Listing History
Unit Highlights
Utilities Included
Utility Type
- Air Conditioning
- Central Air
- Heat Source
- No Data
- Heating
- Forced Air
Room Dimensions
About this Listing
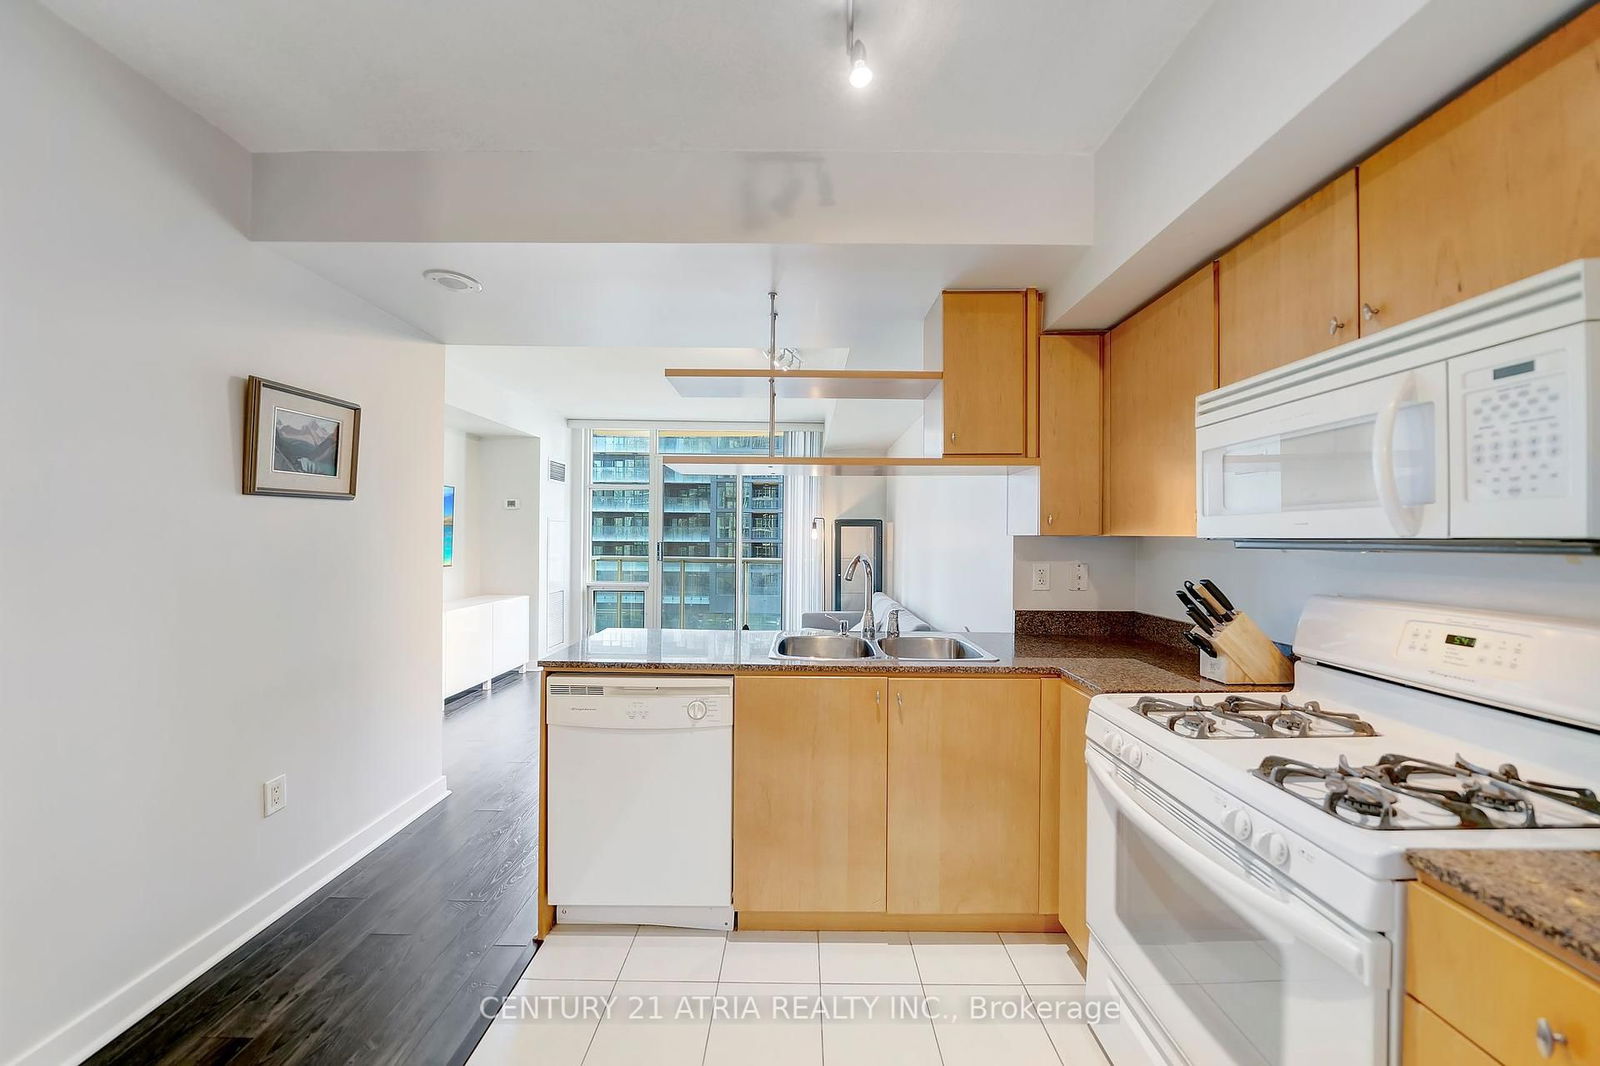
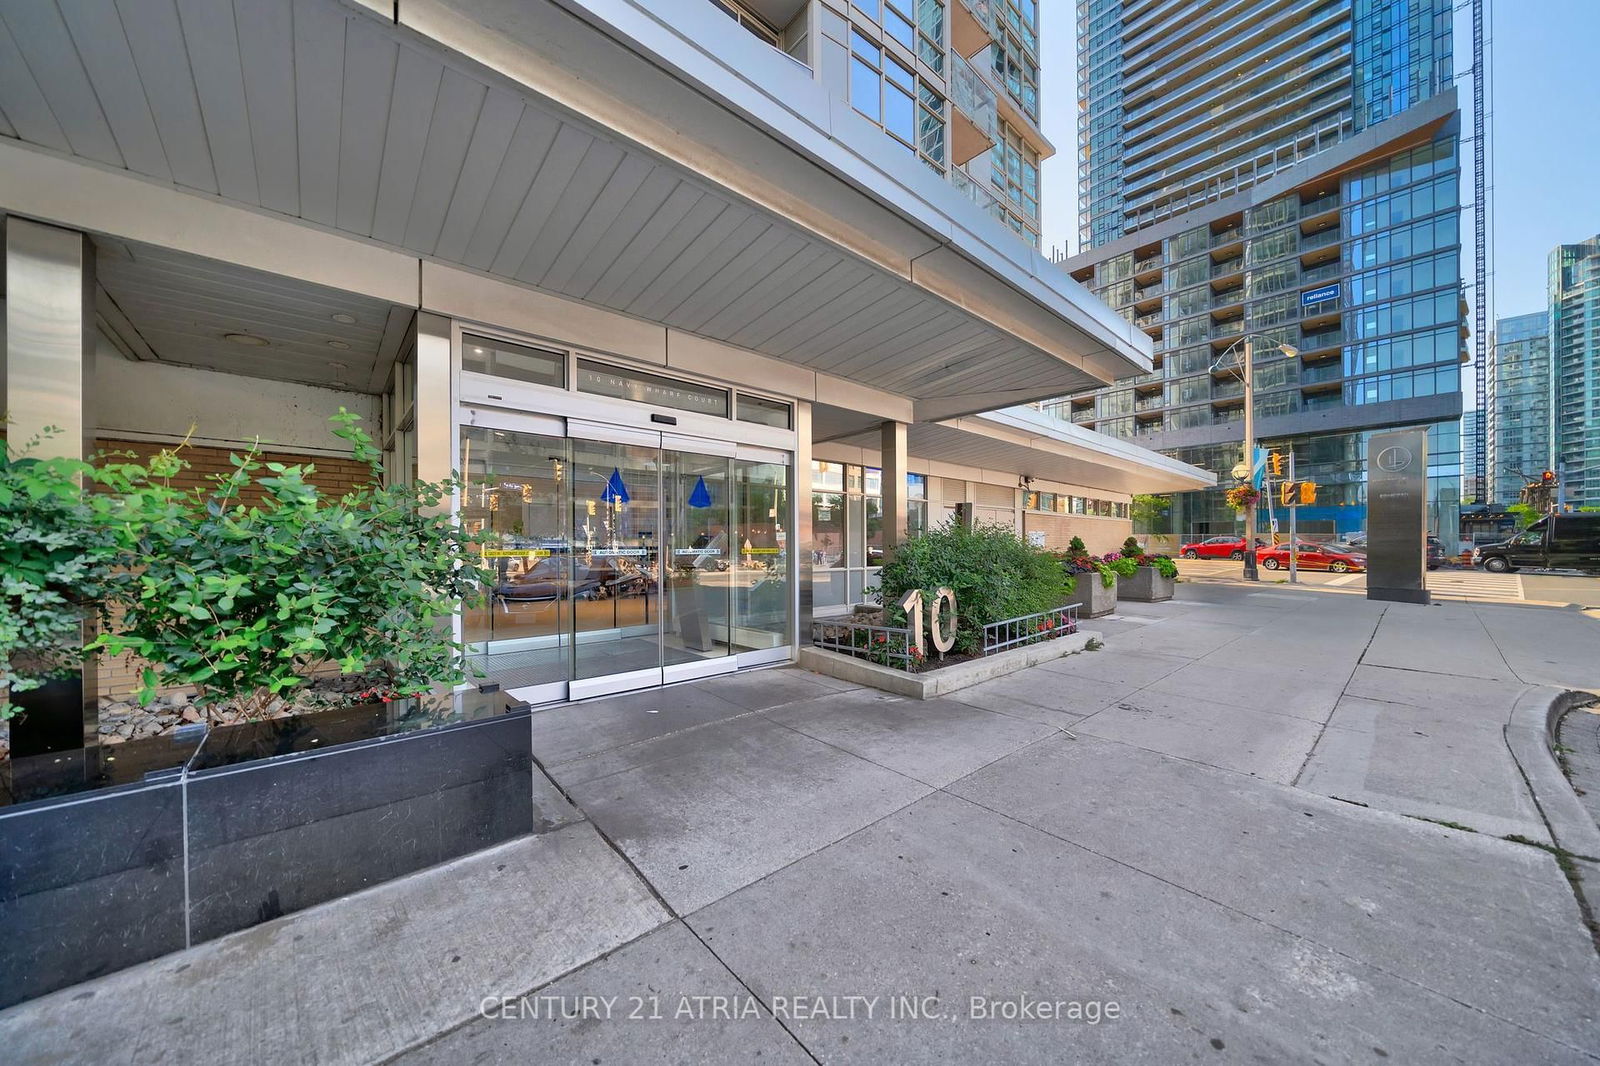
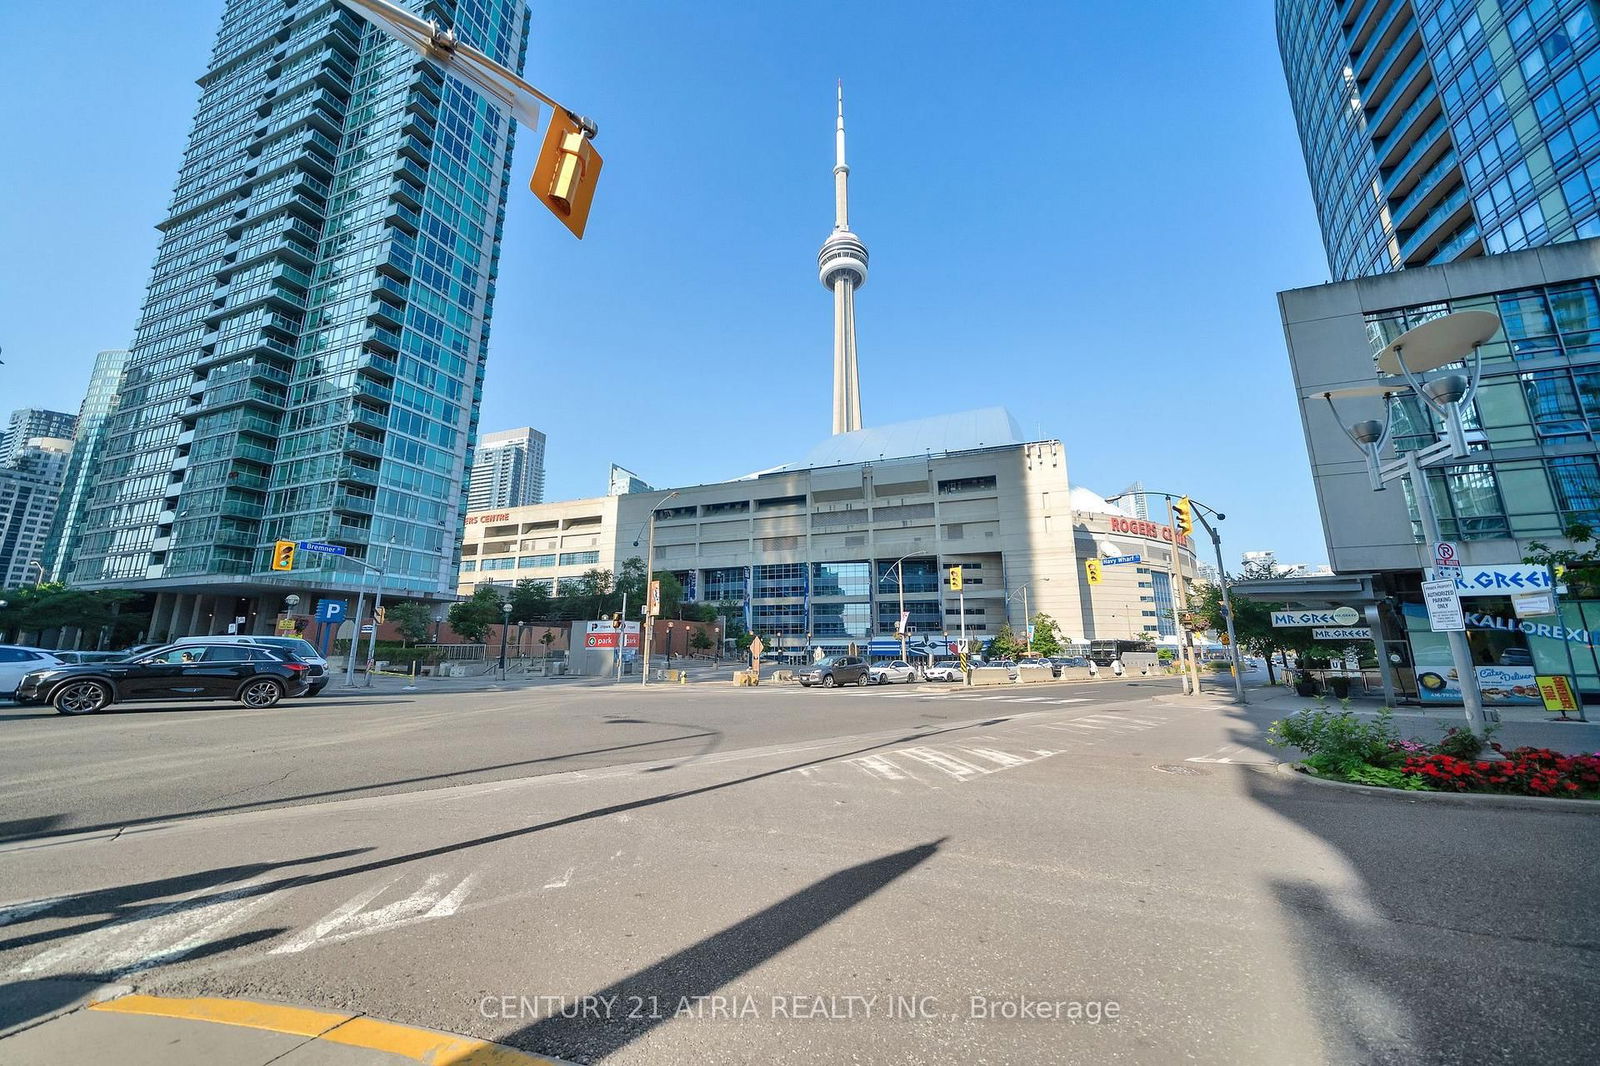
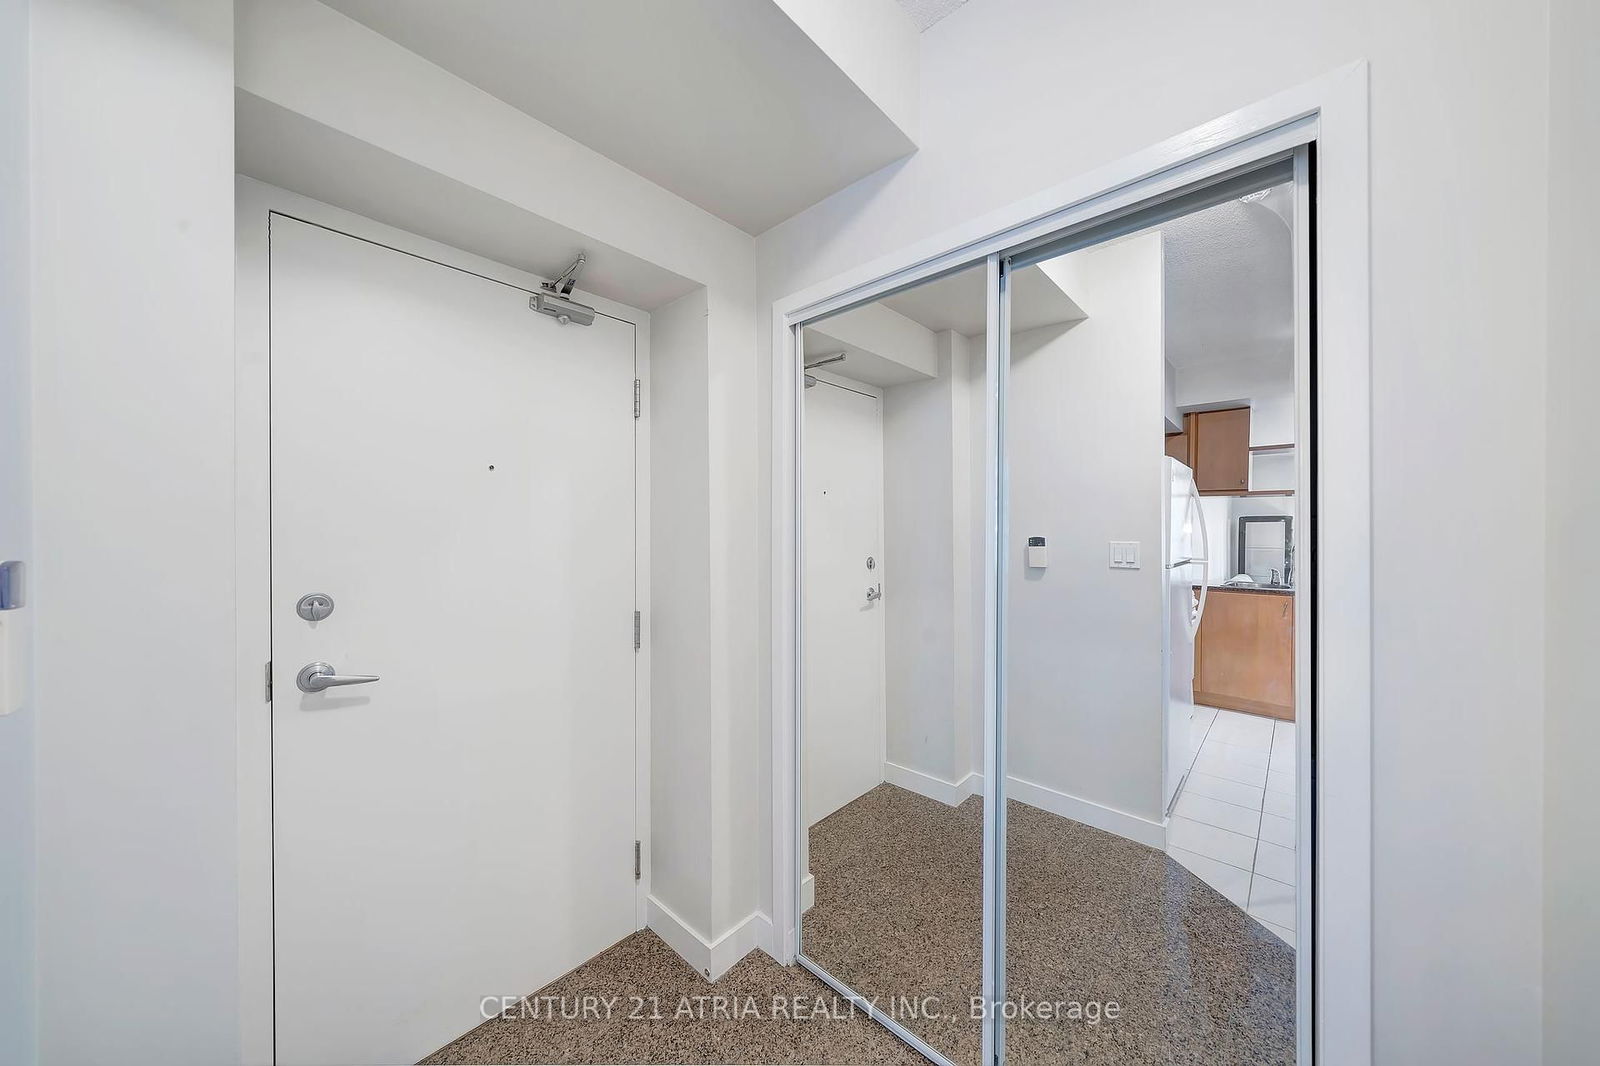
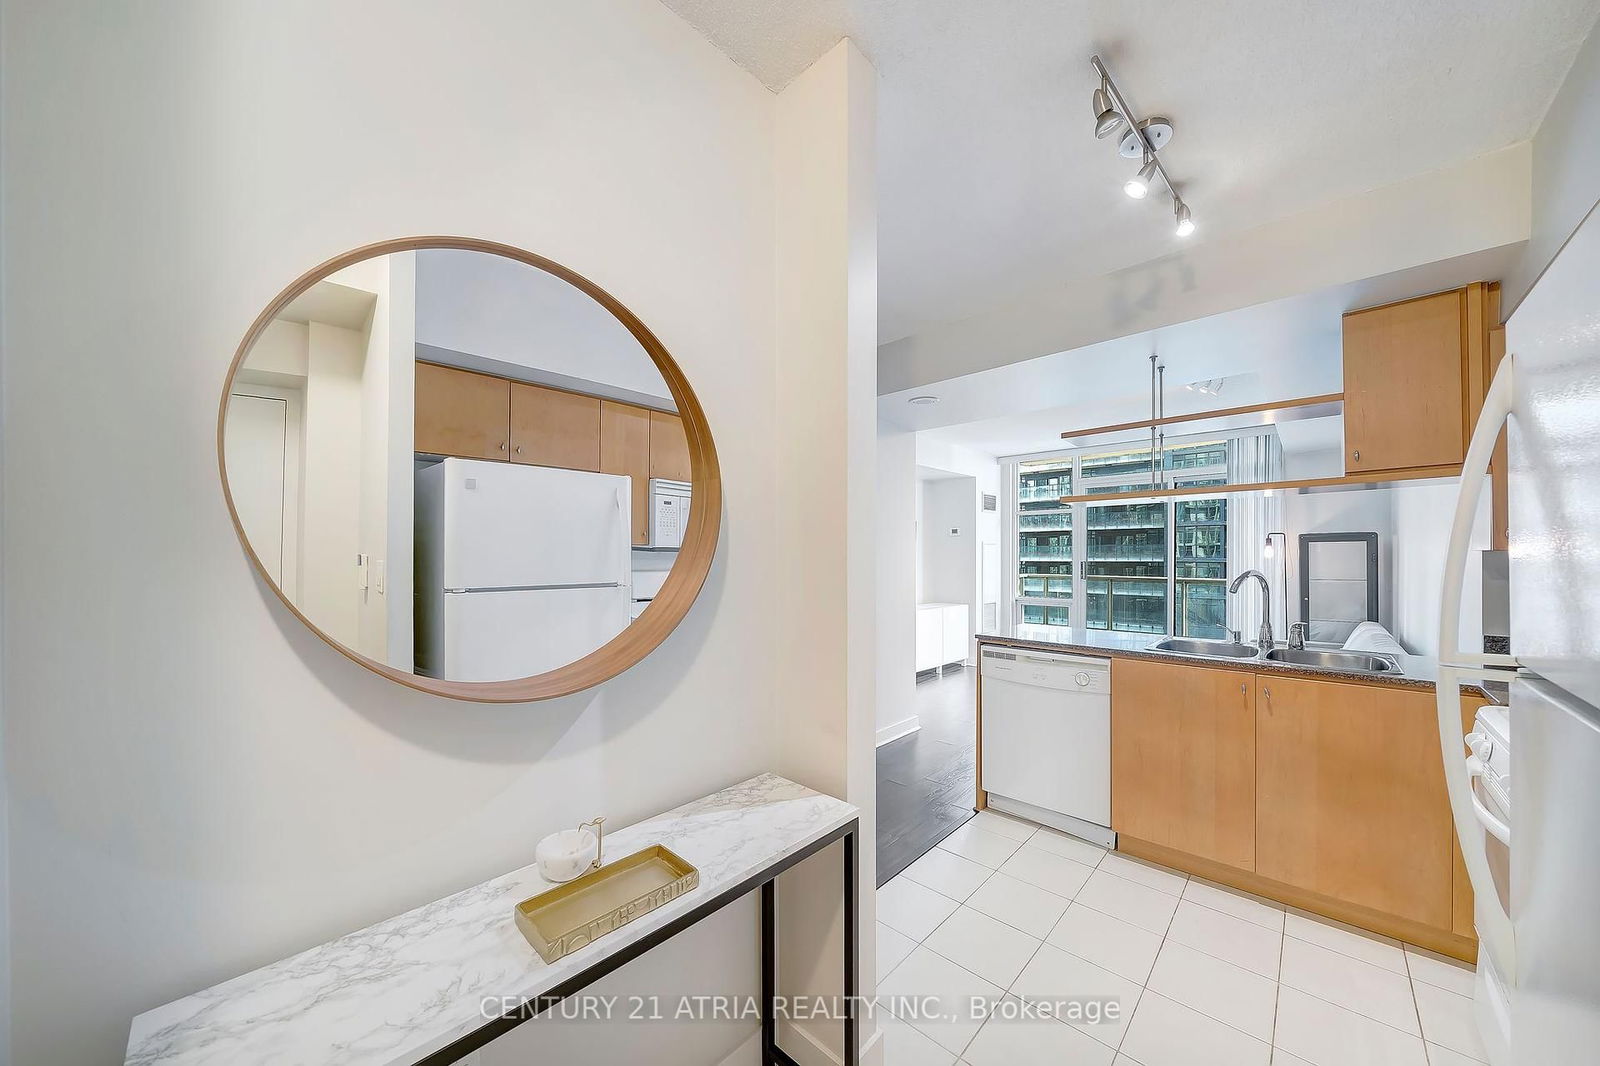
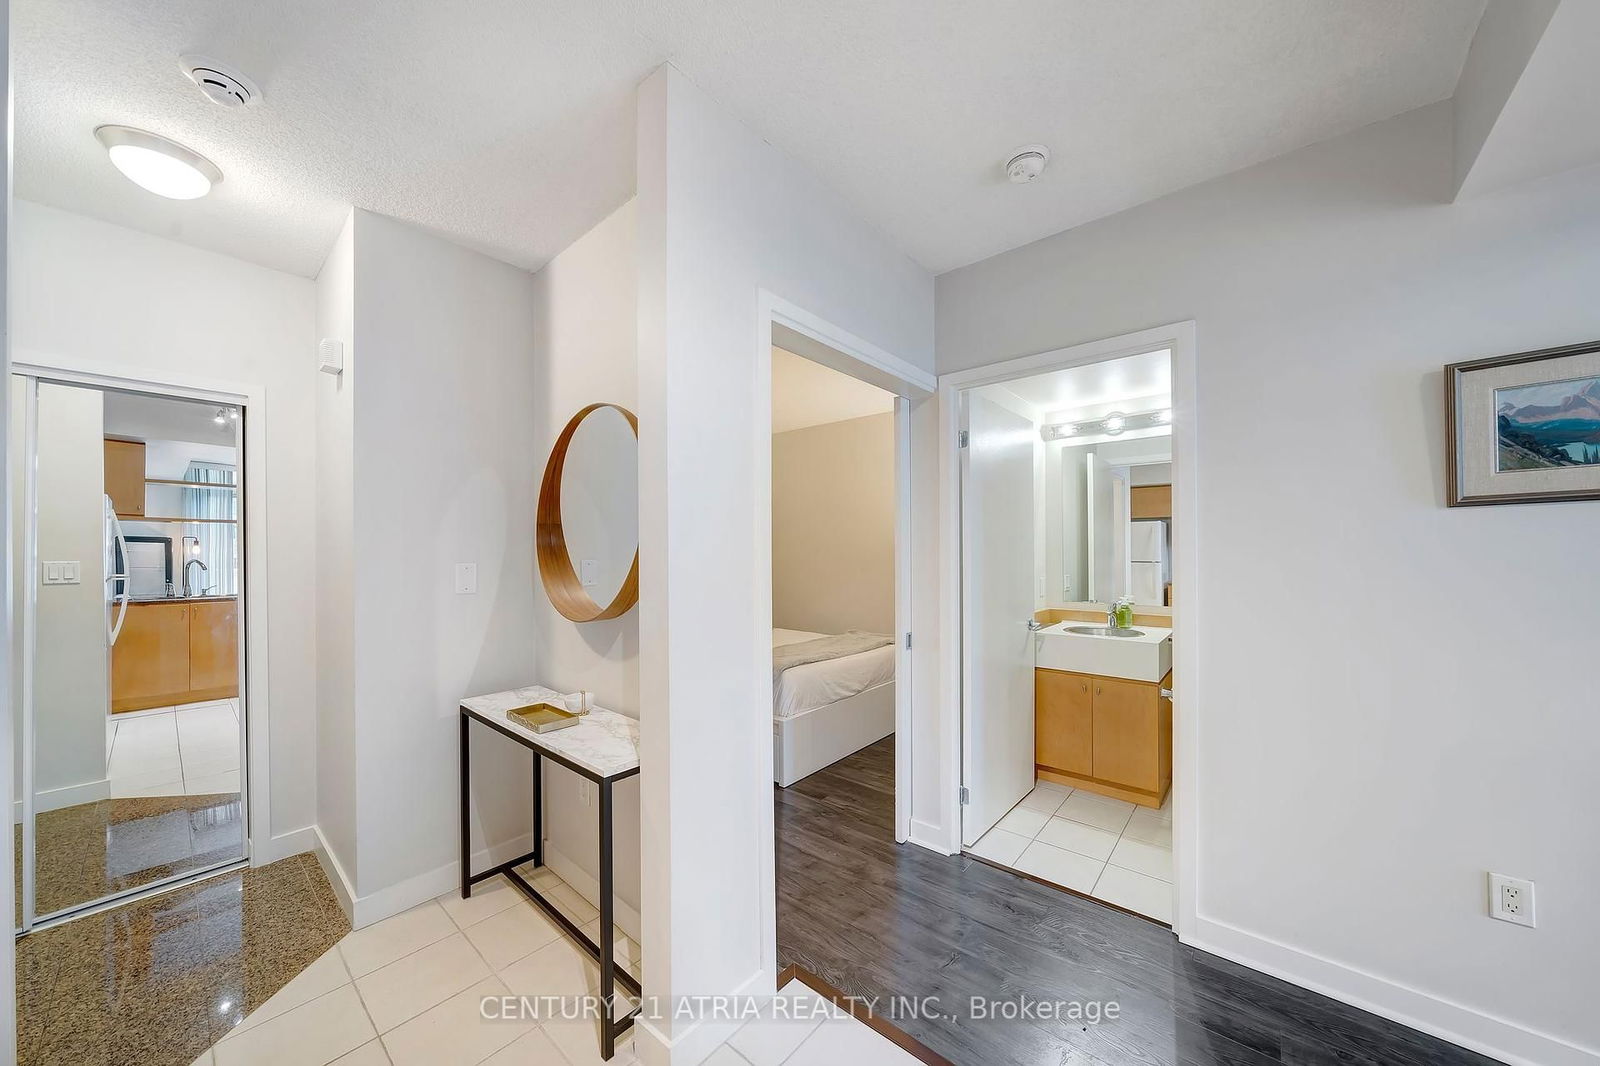
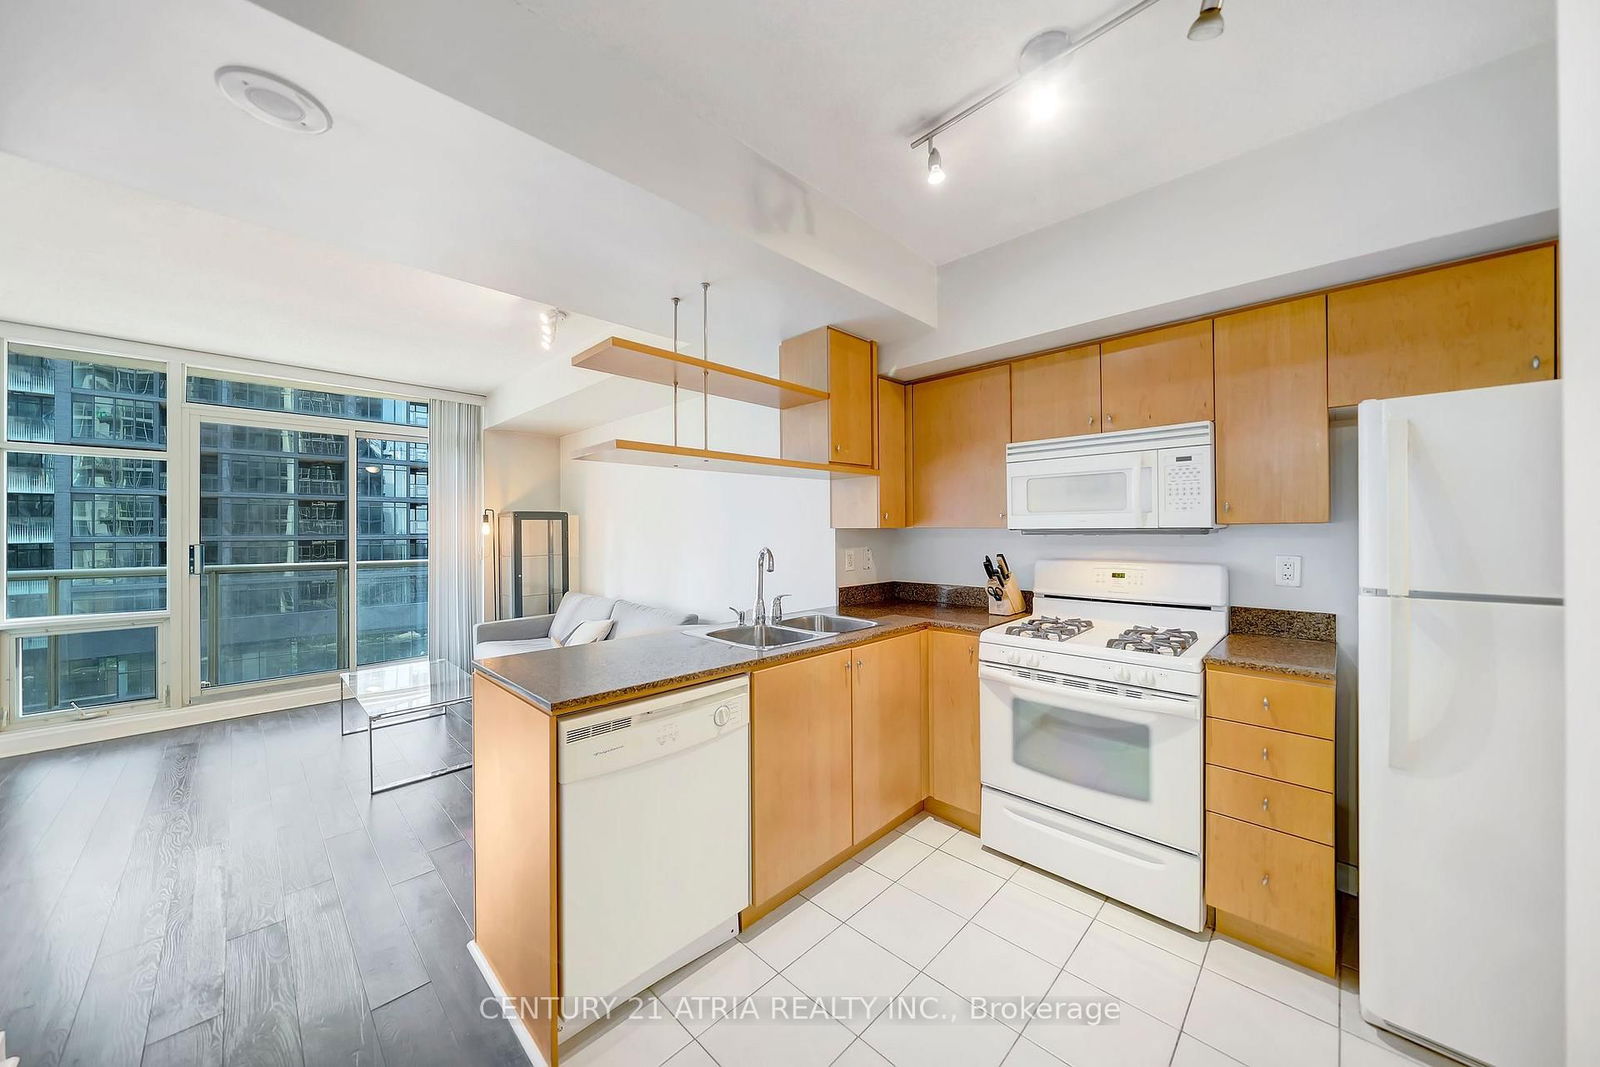
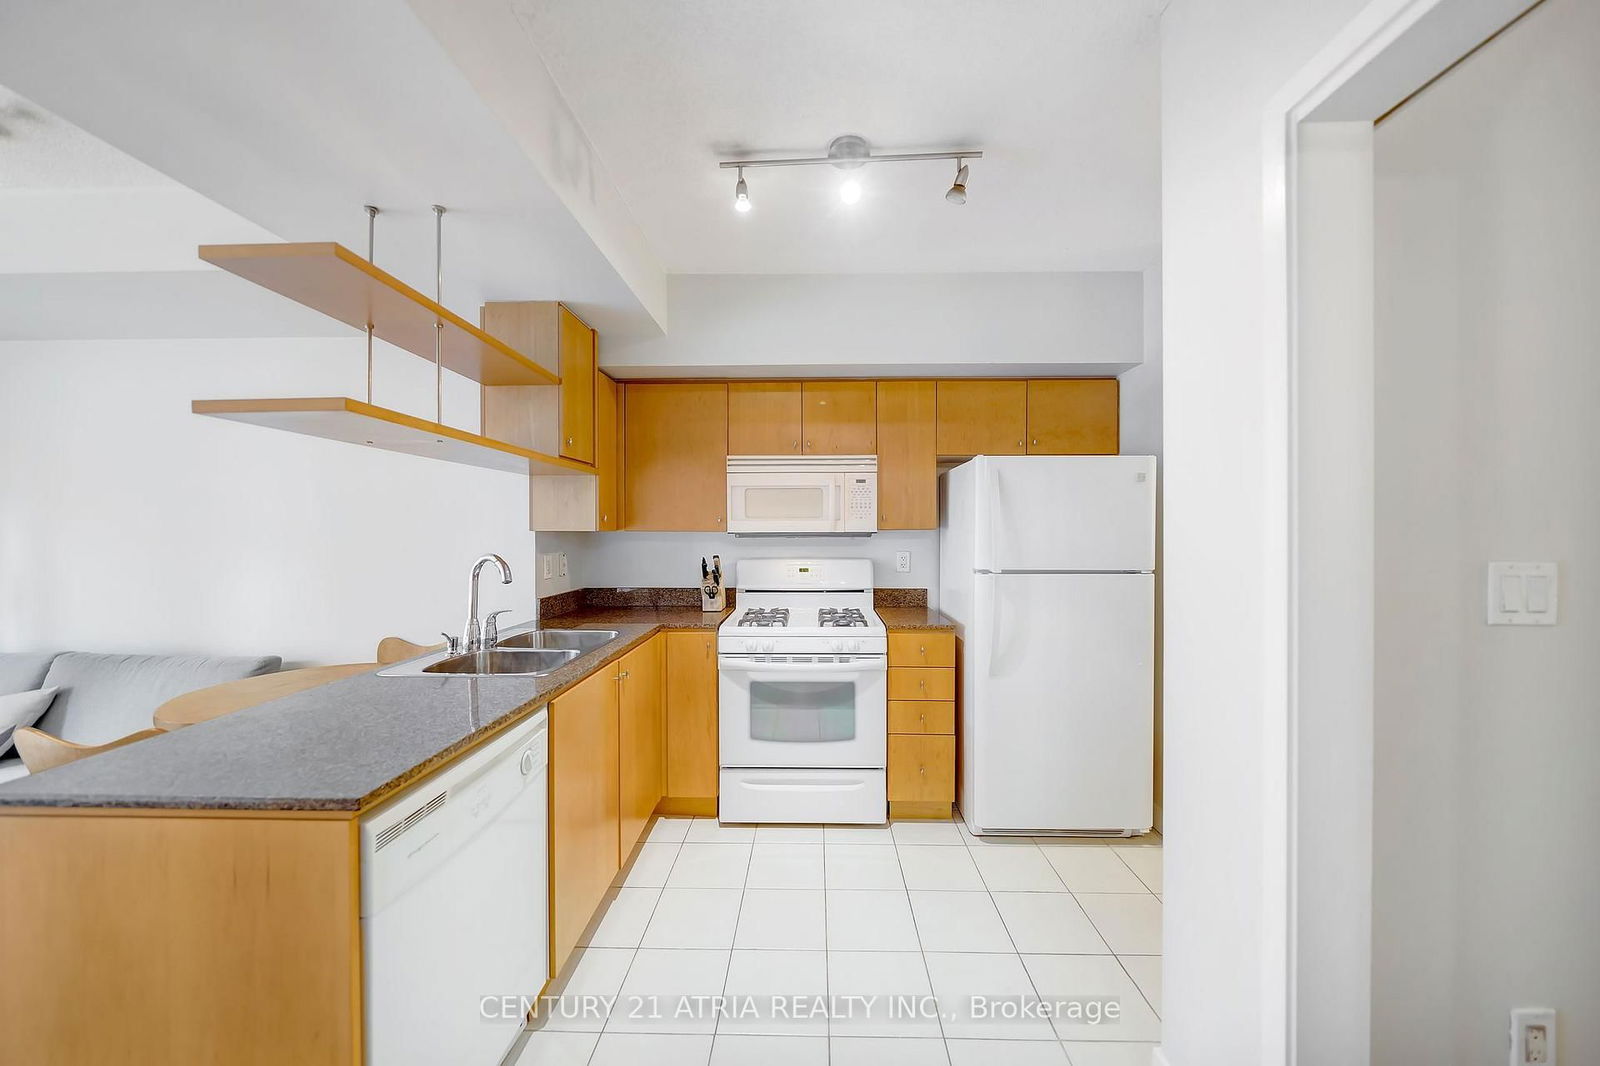
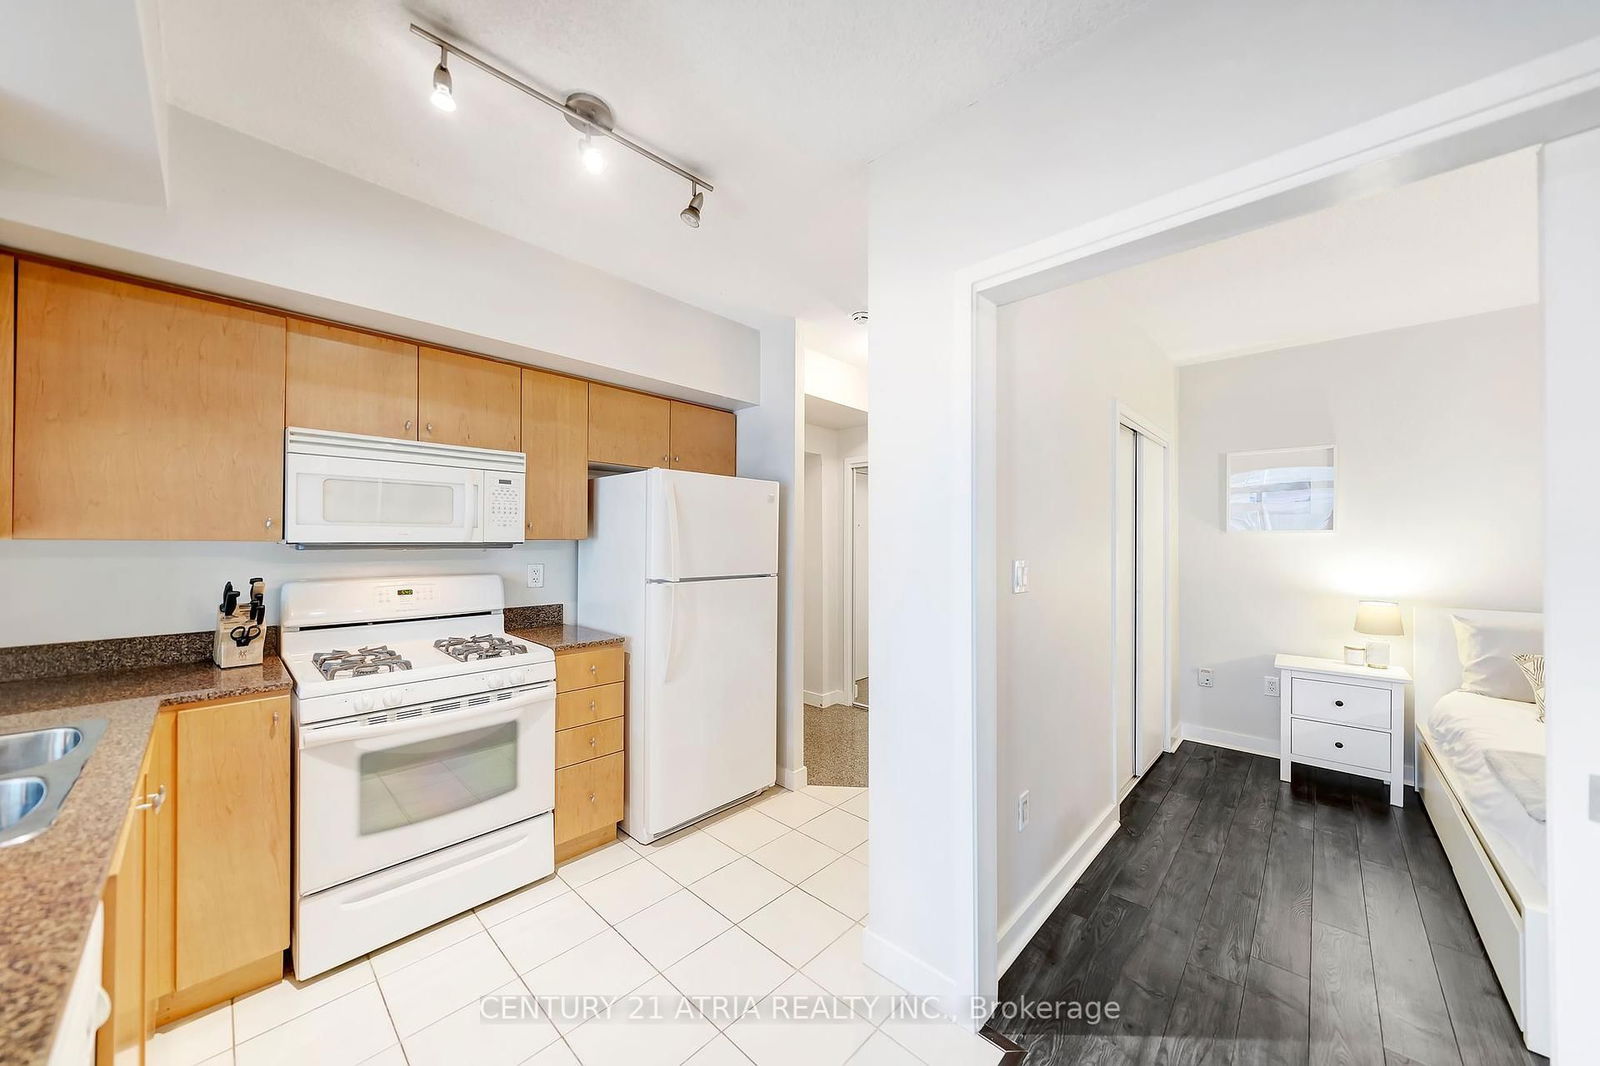
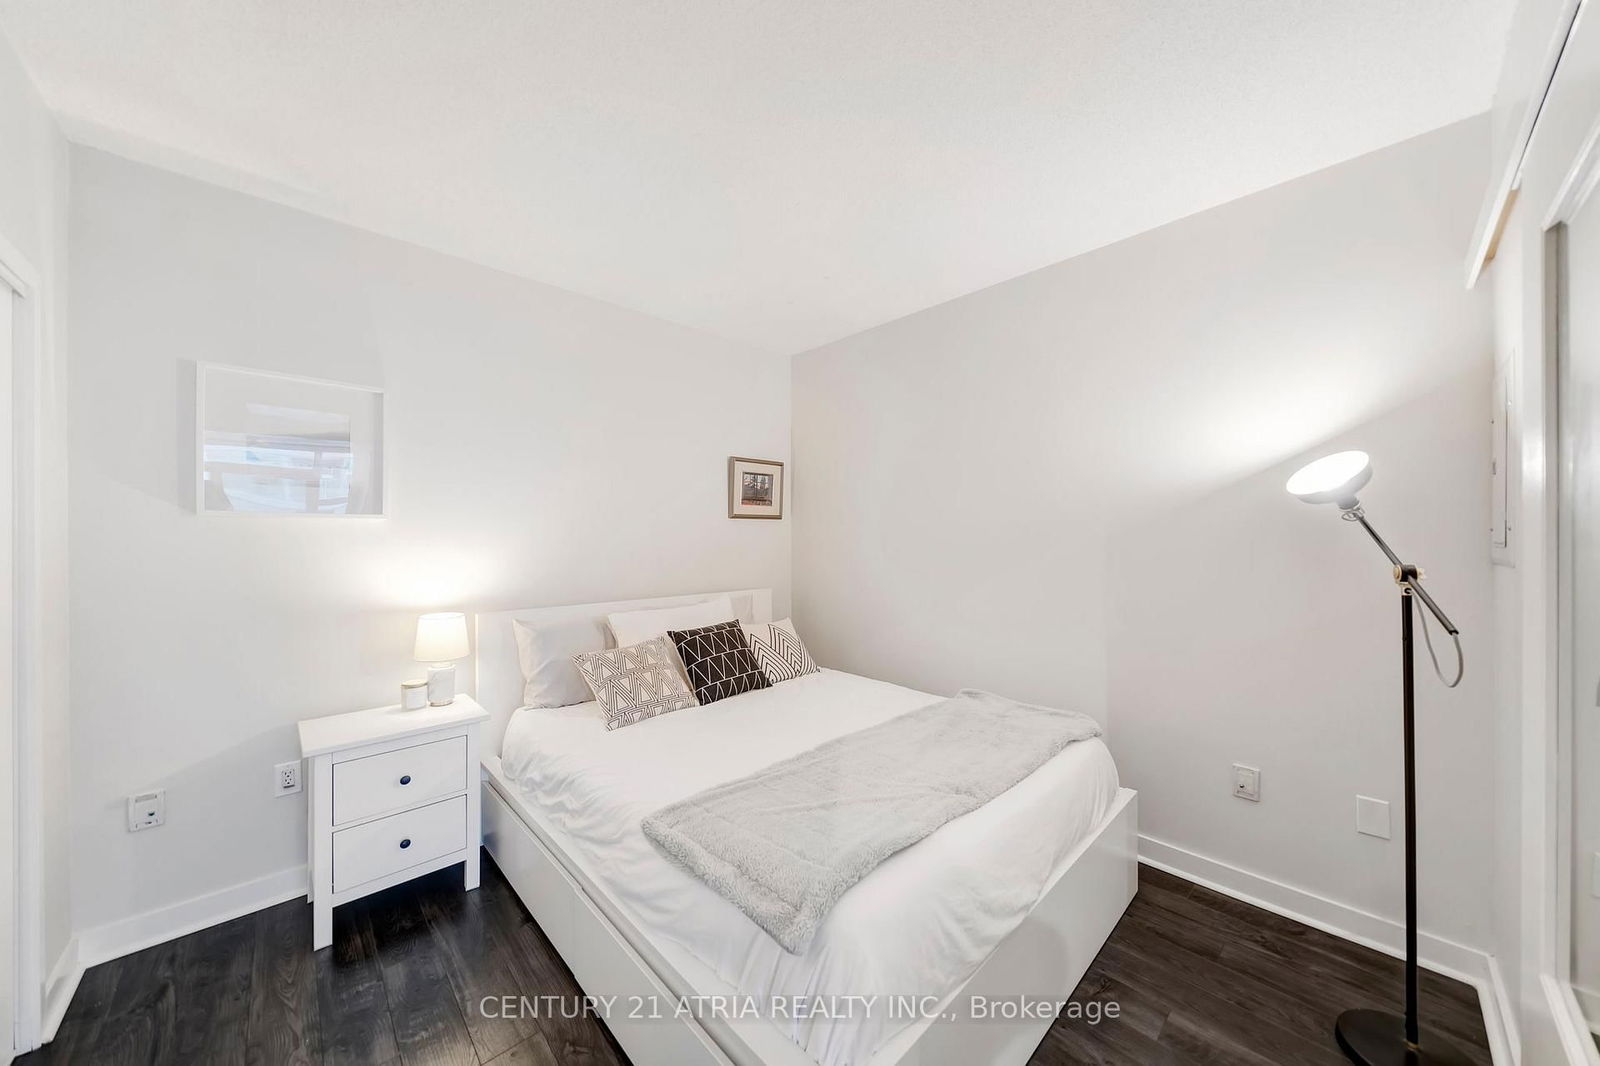
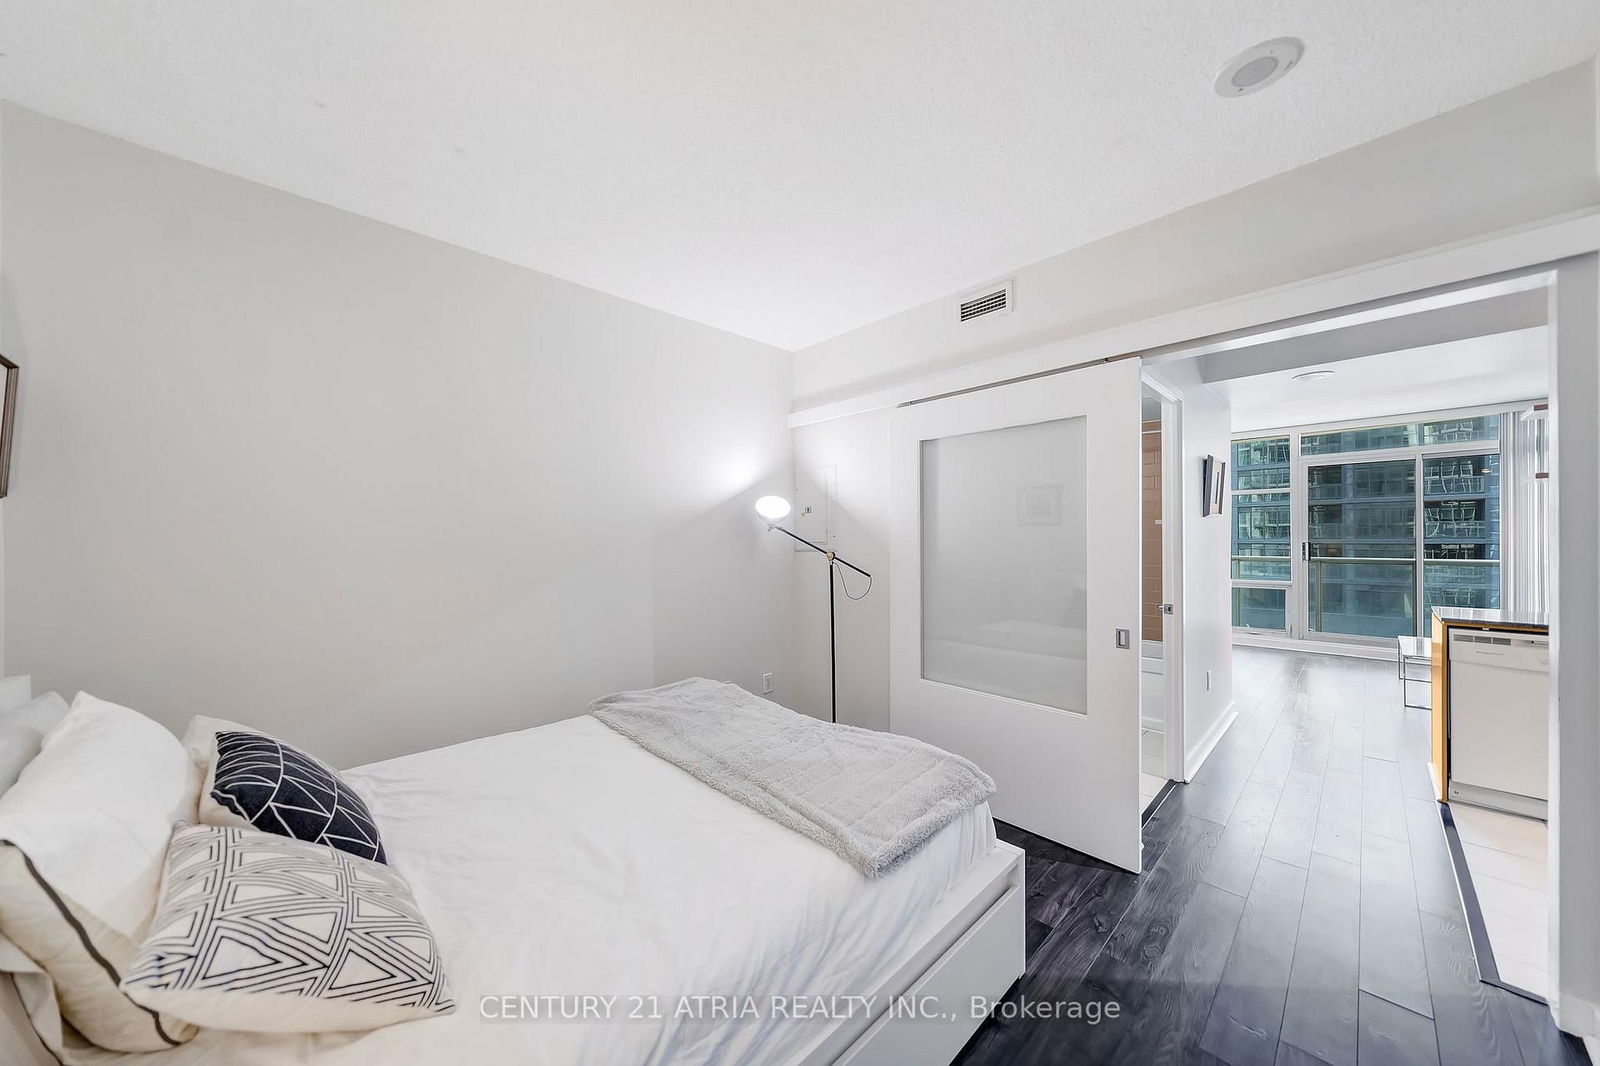
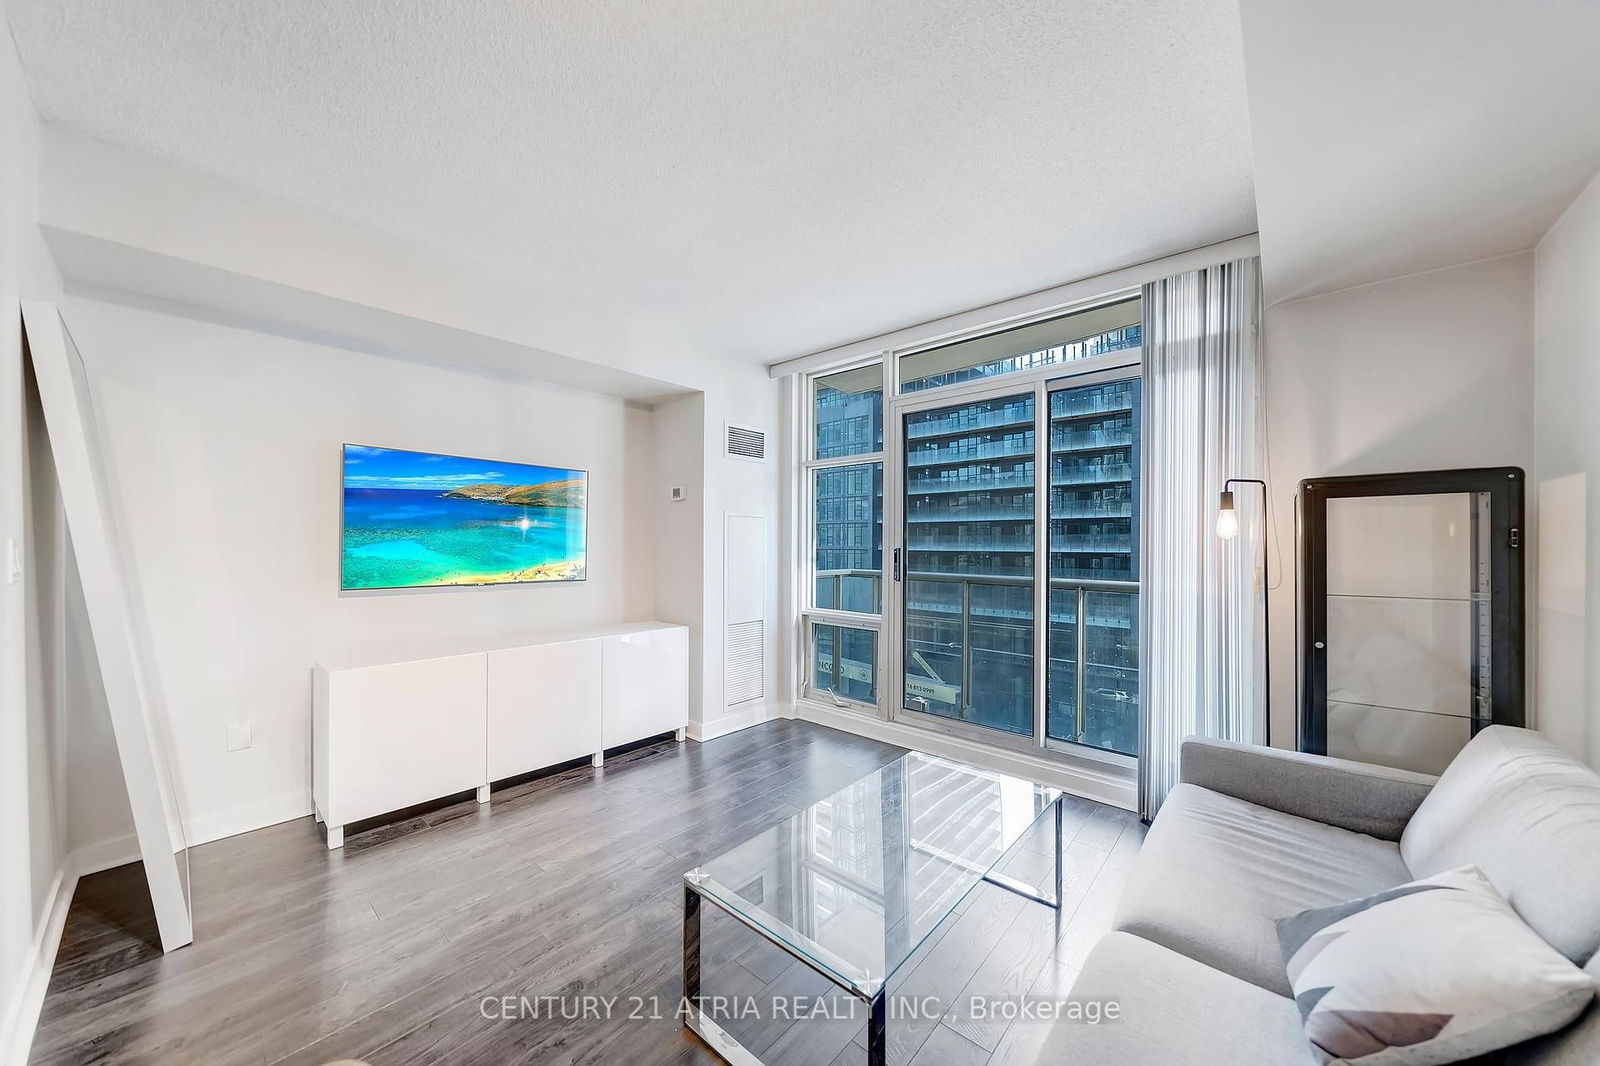
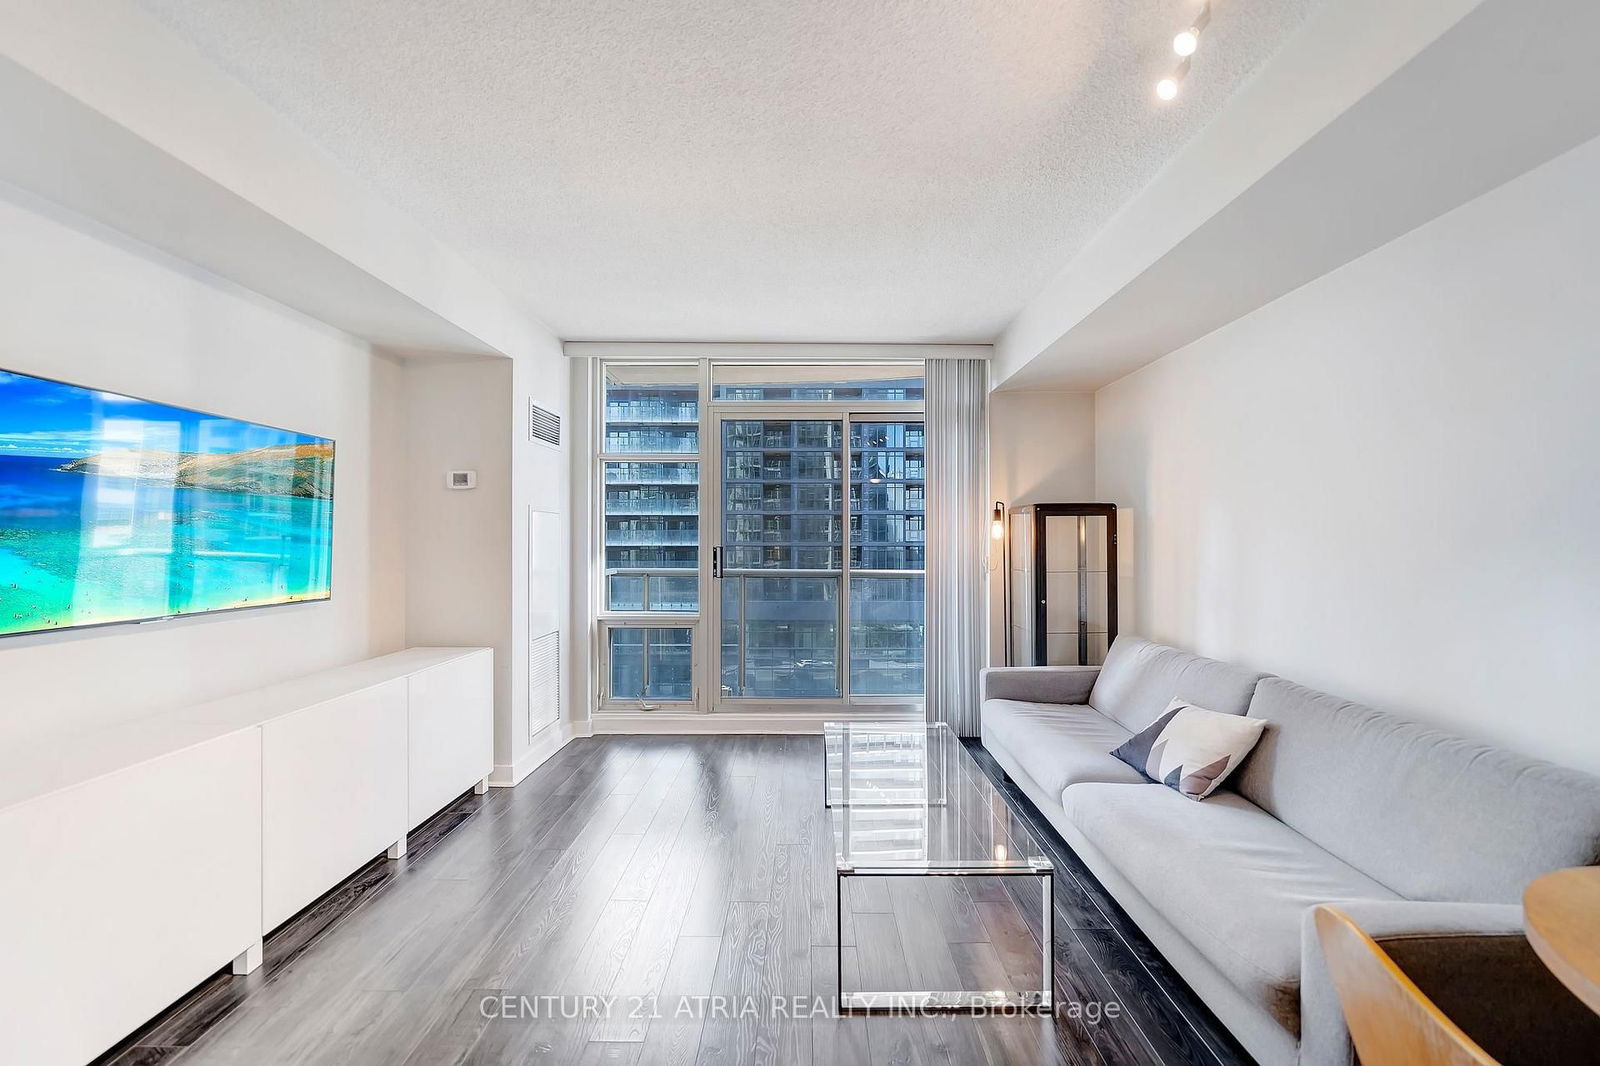
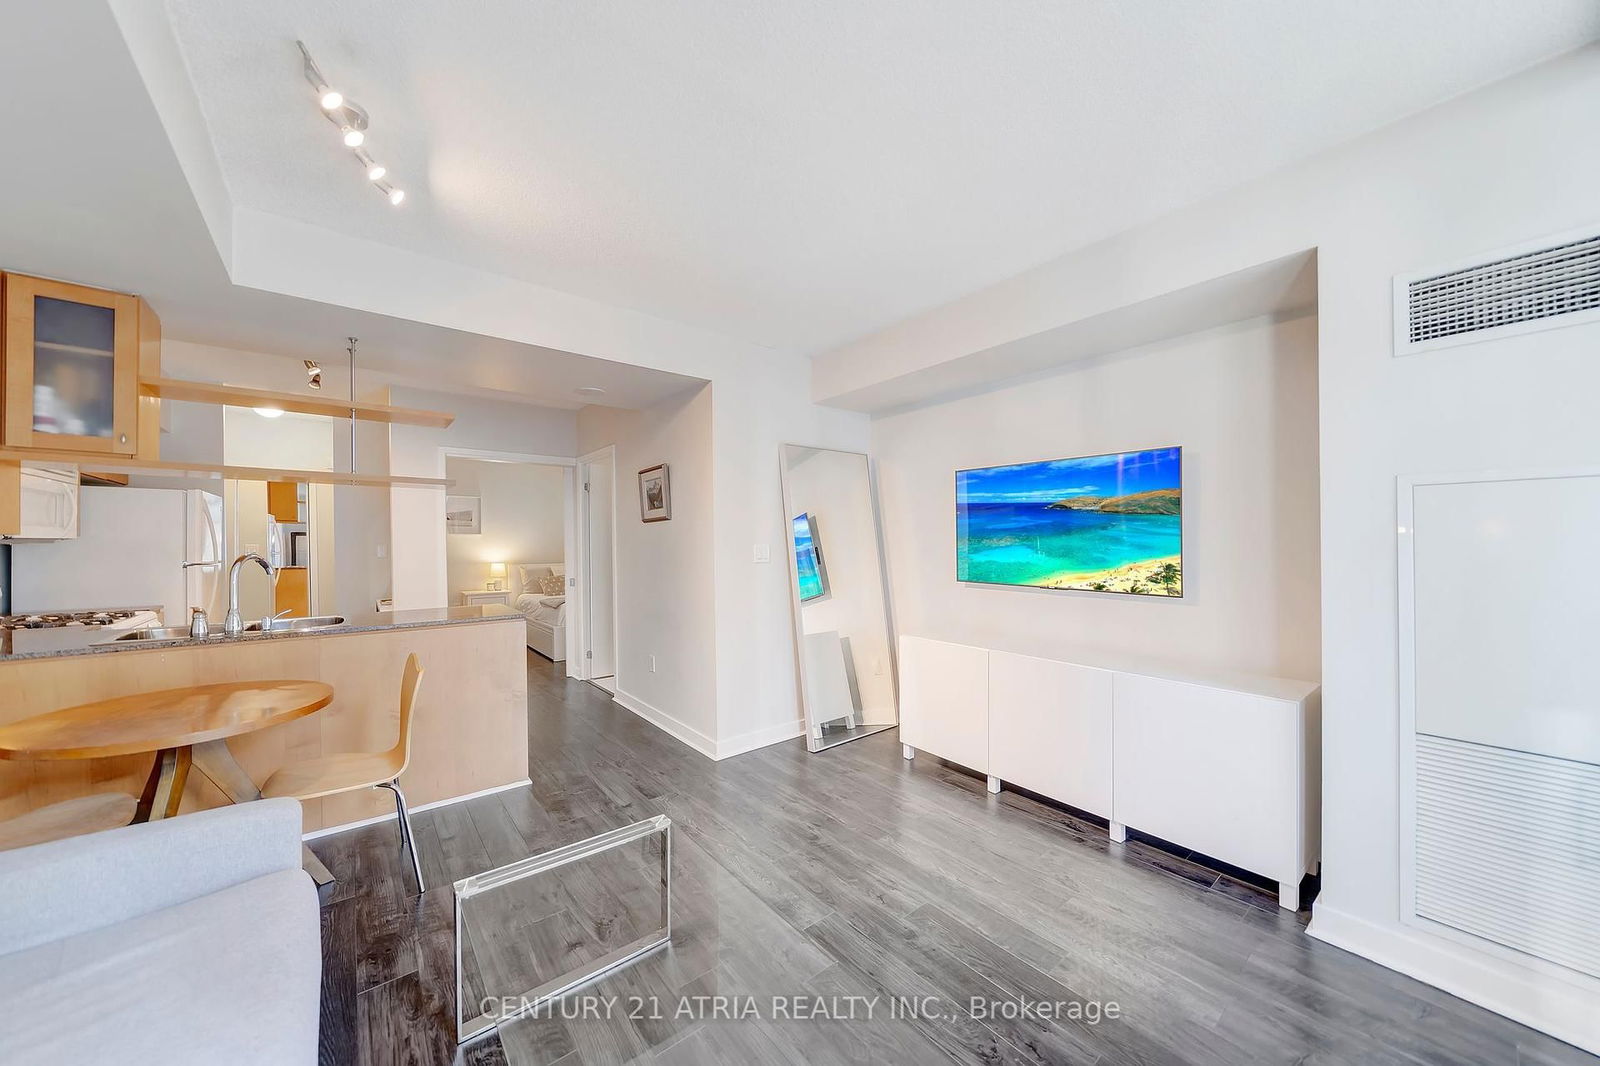
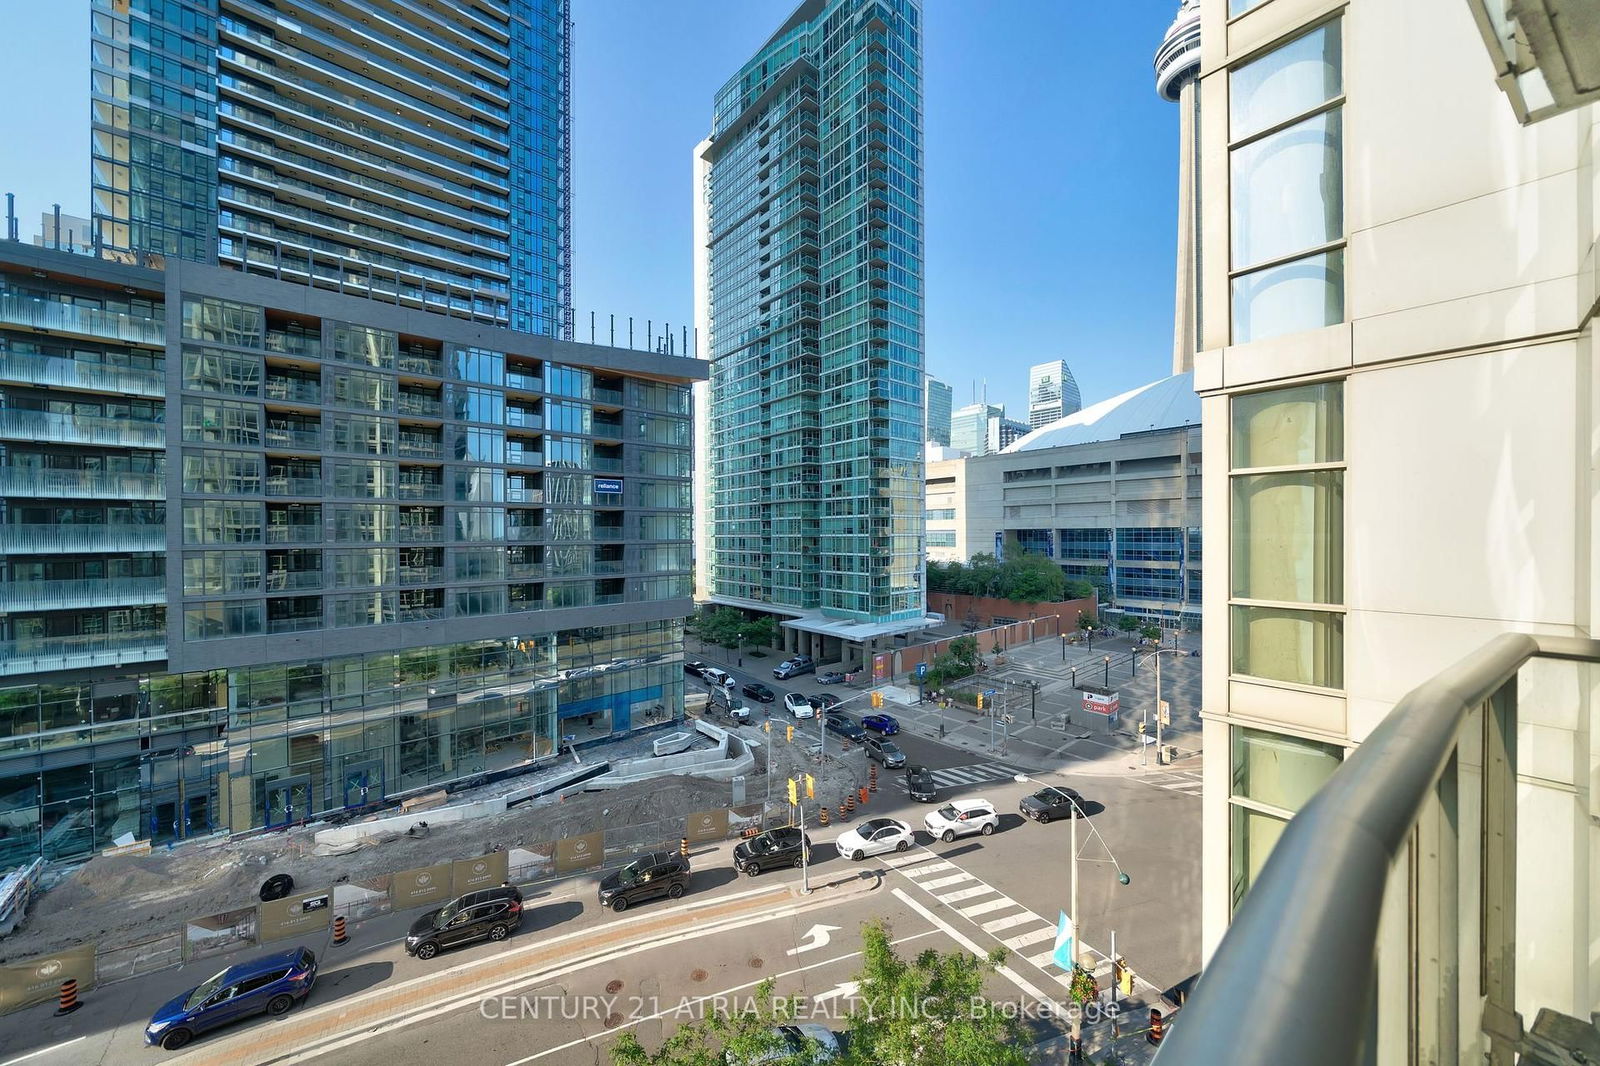
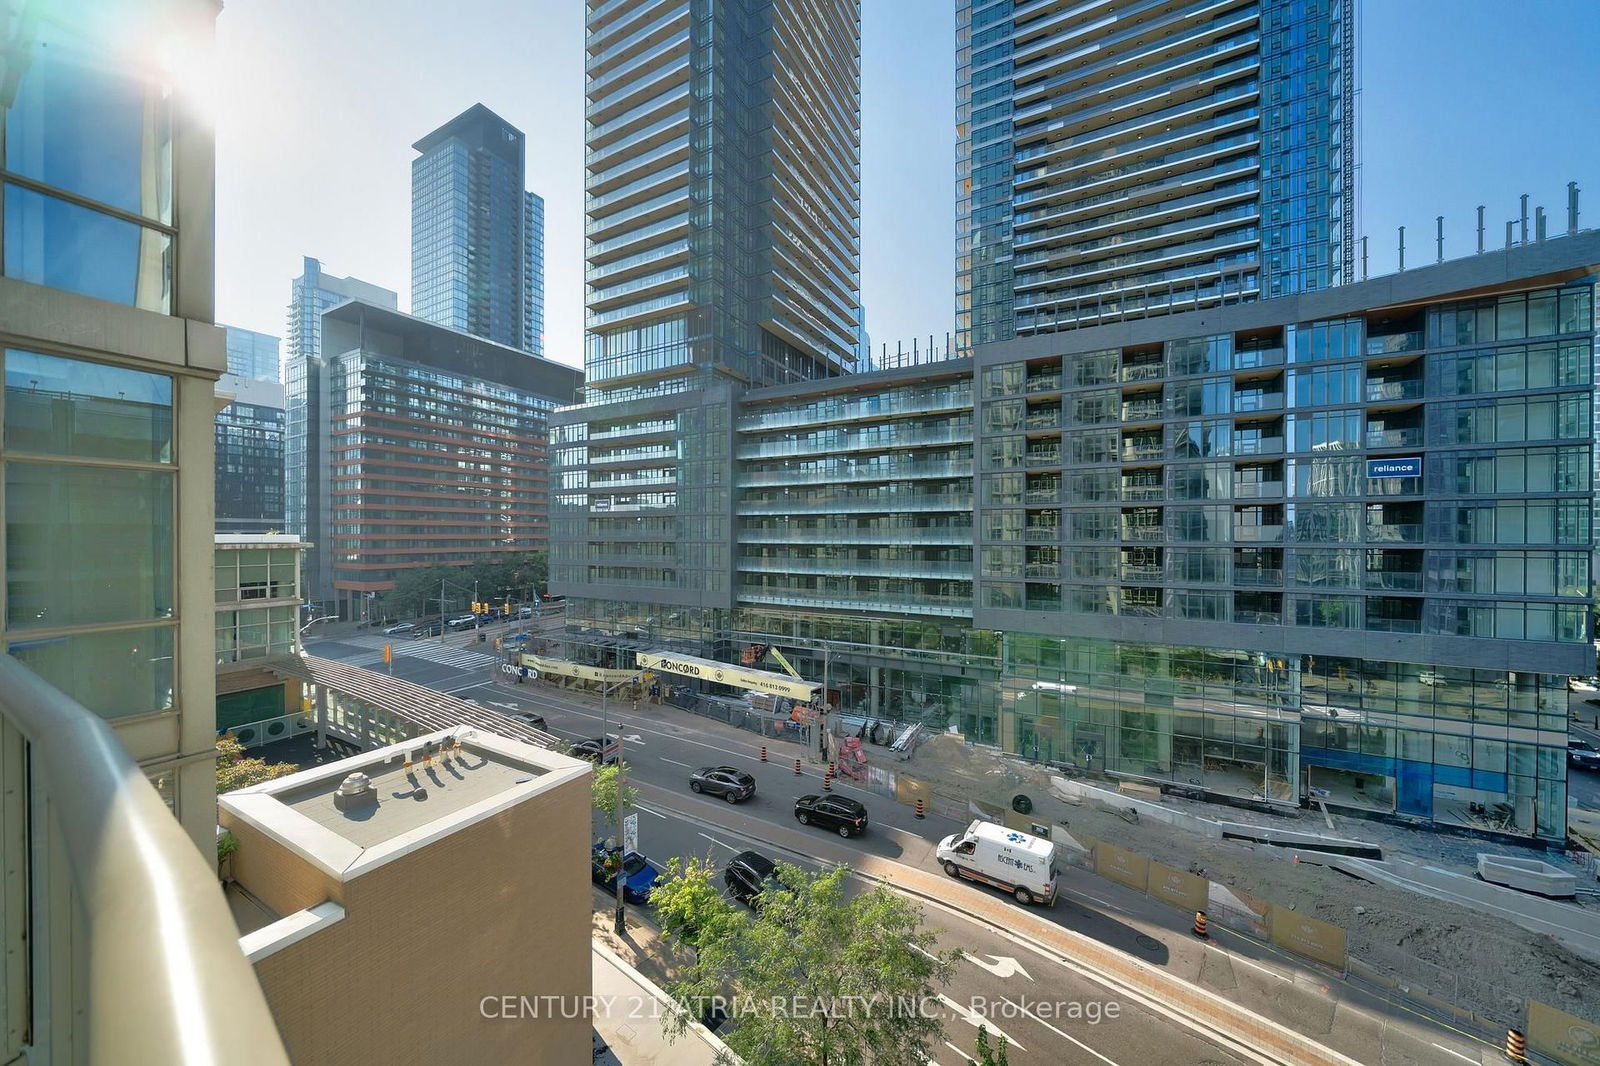
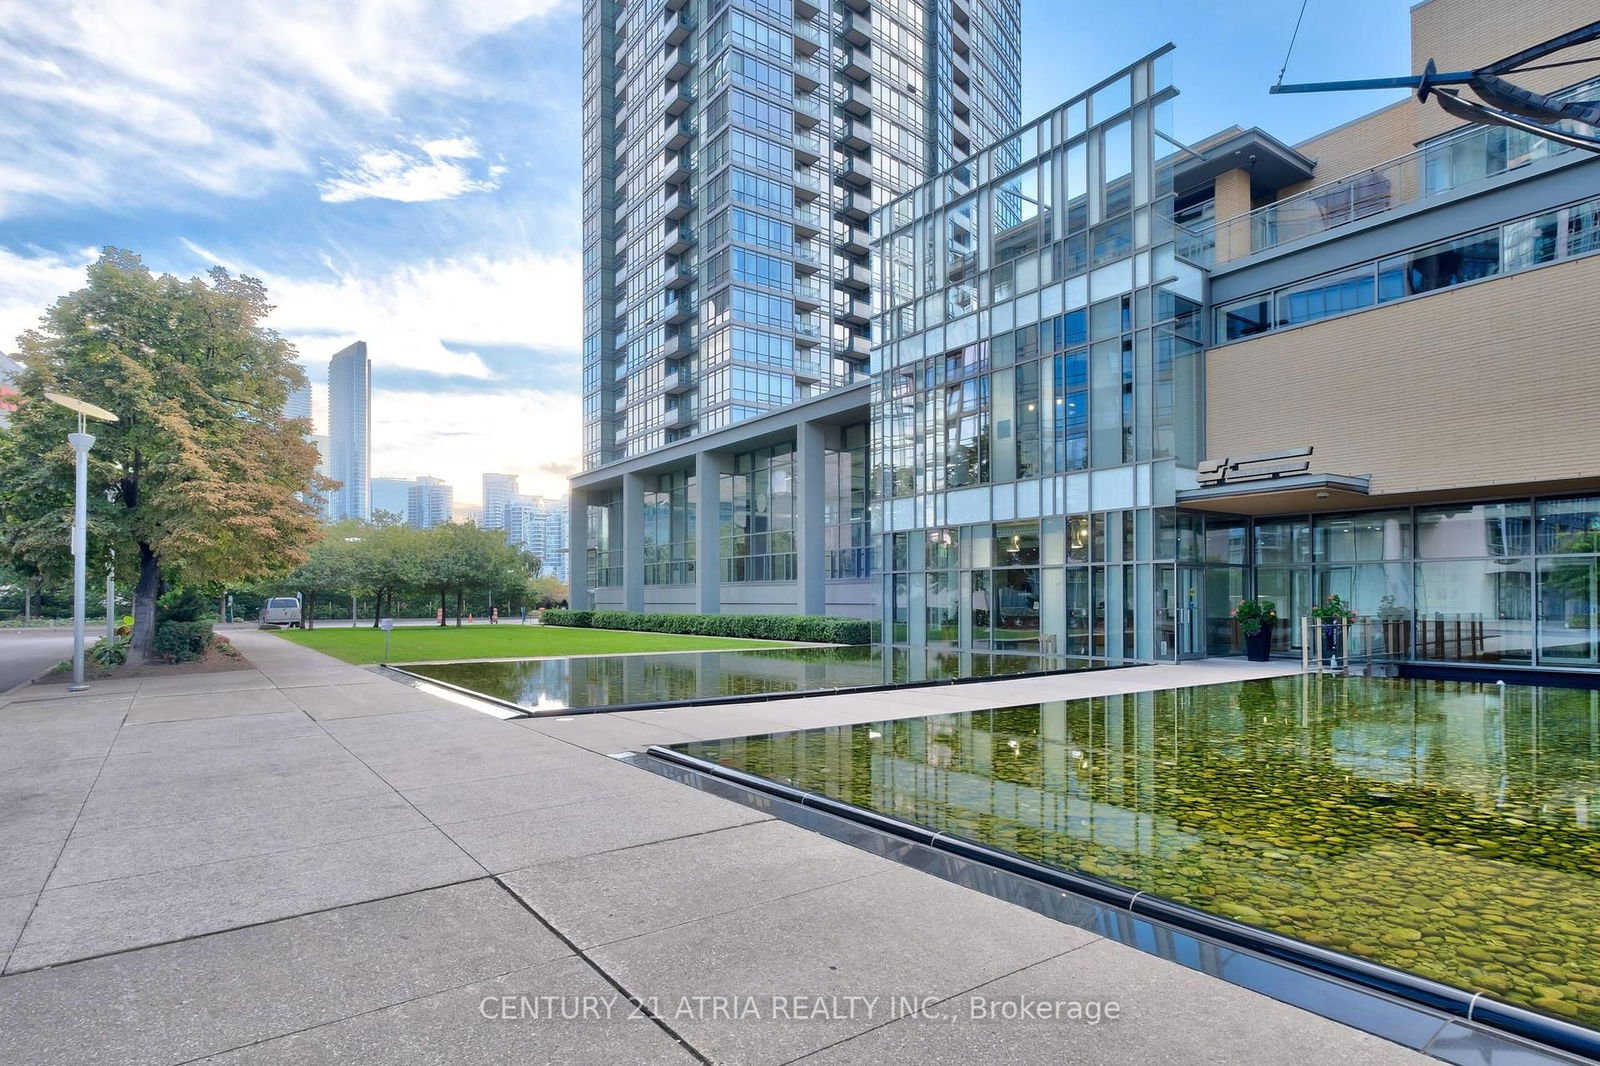
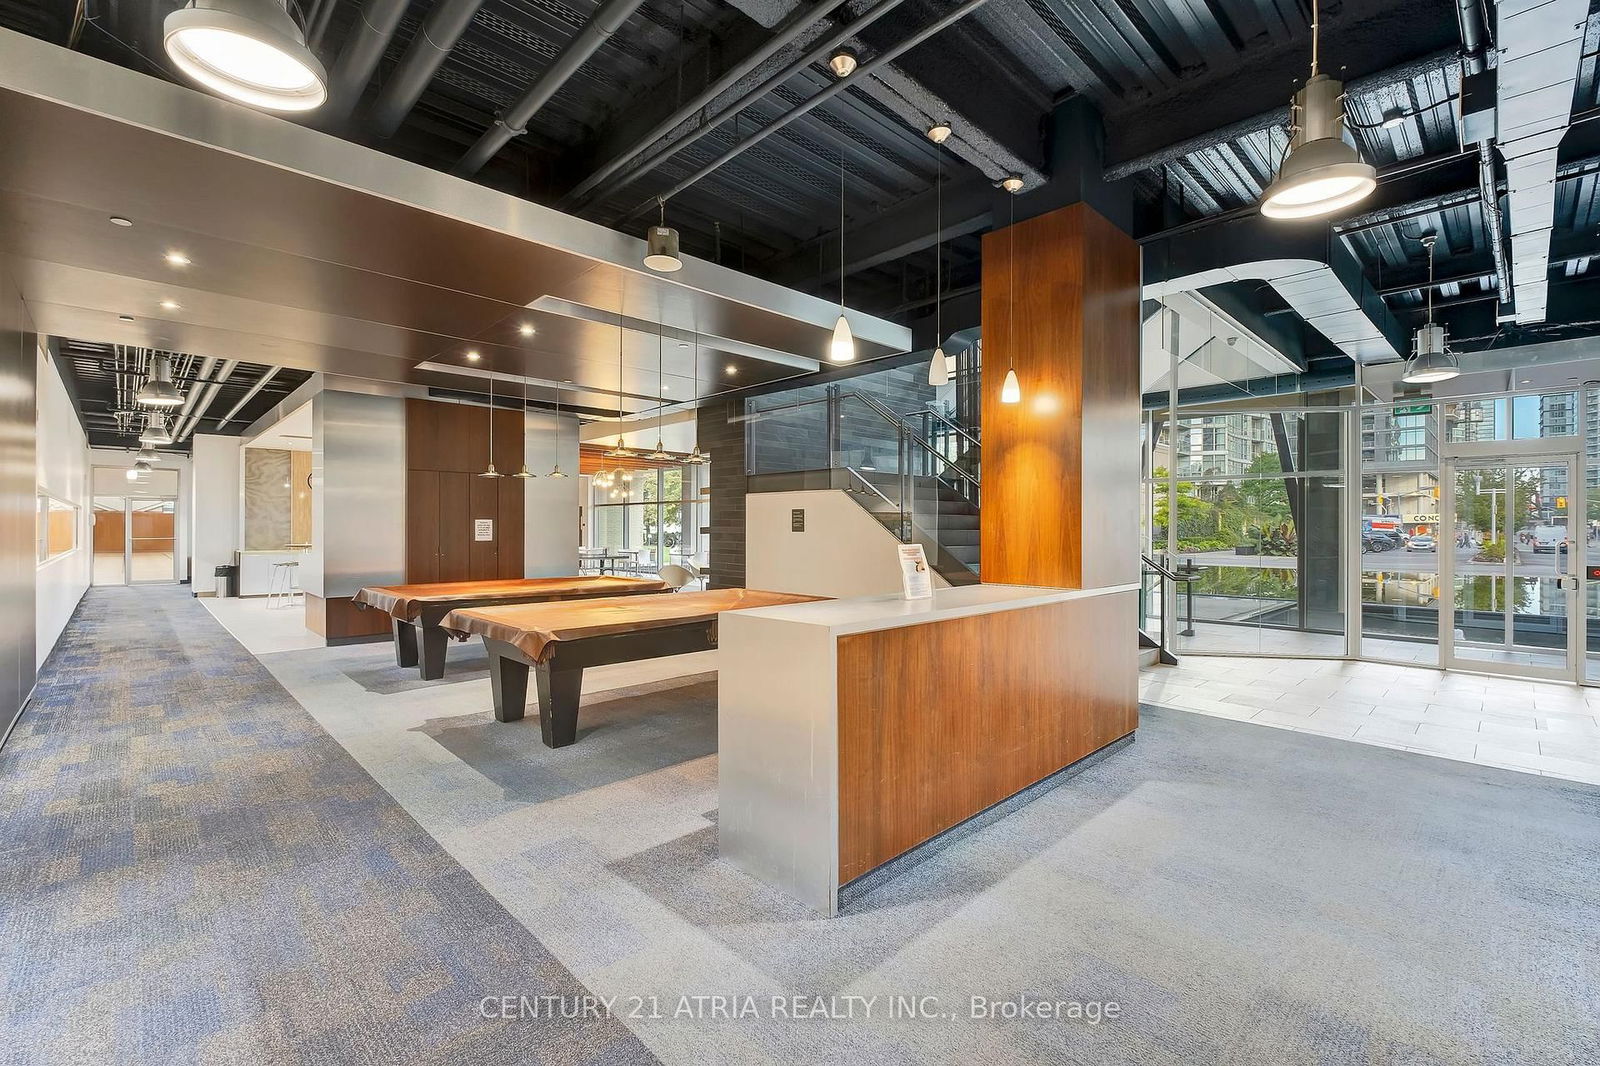
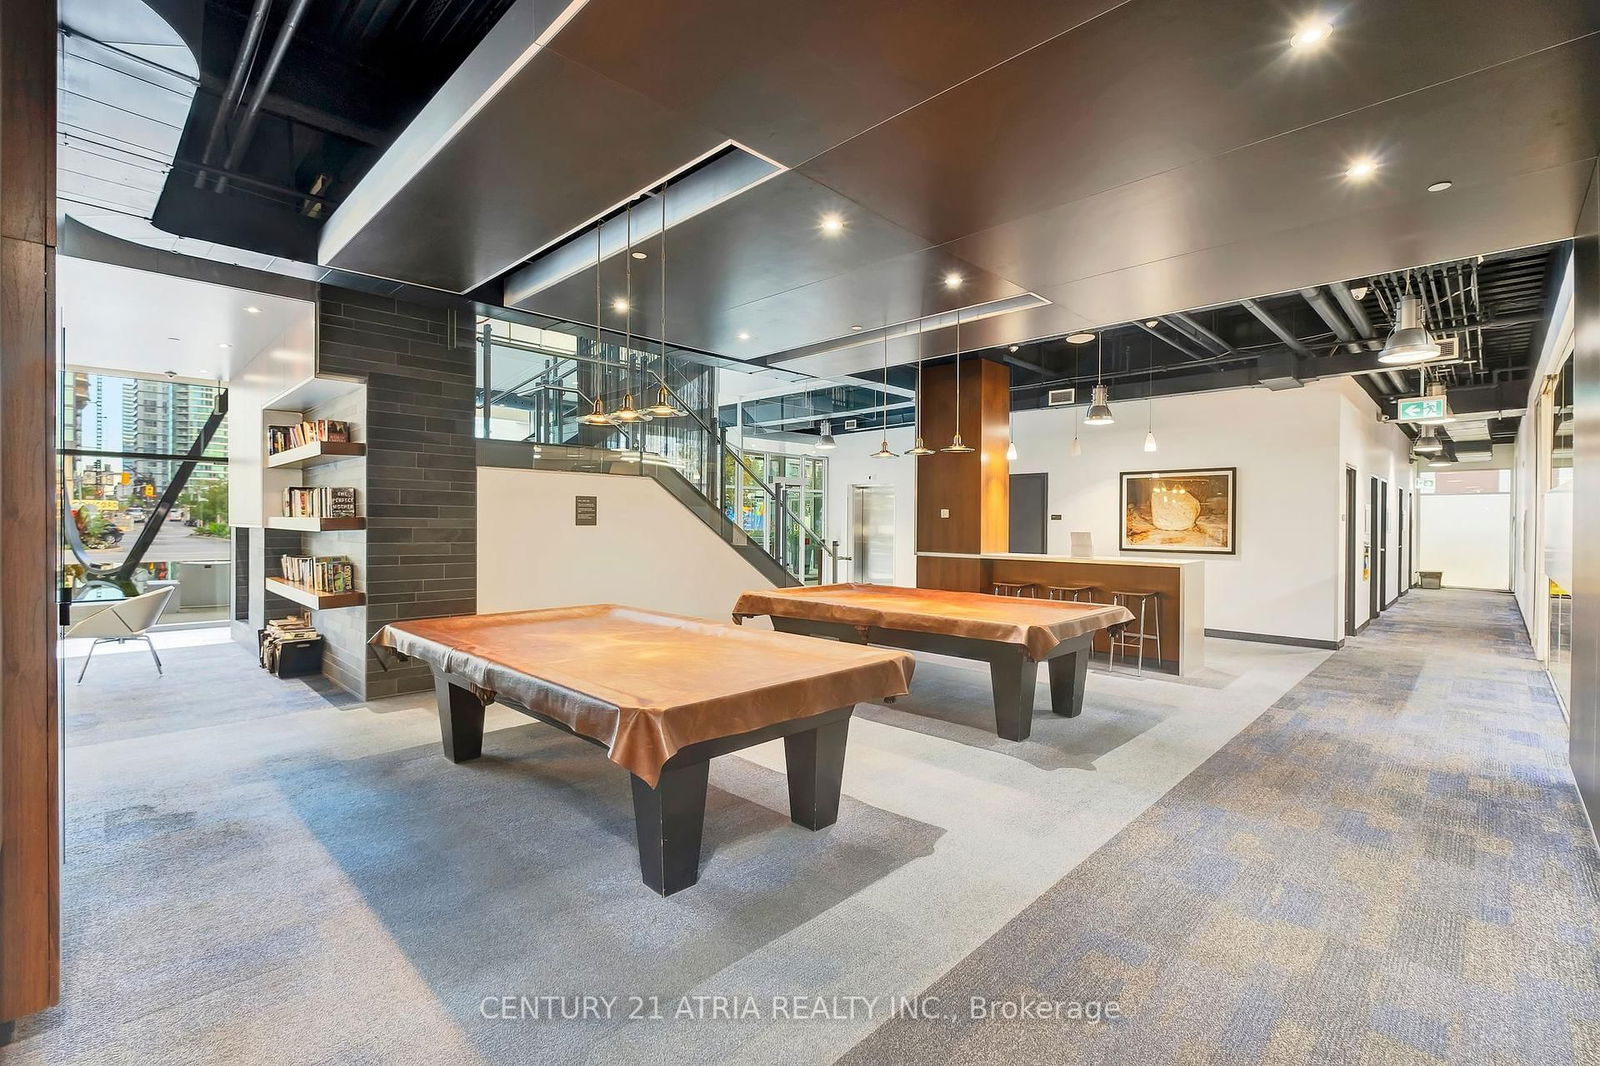
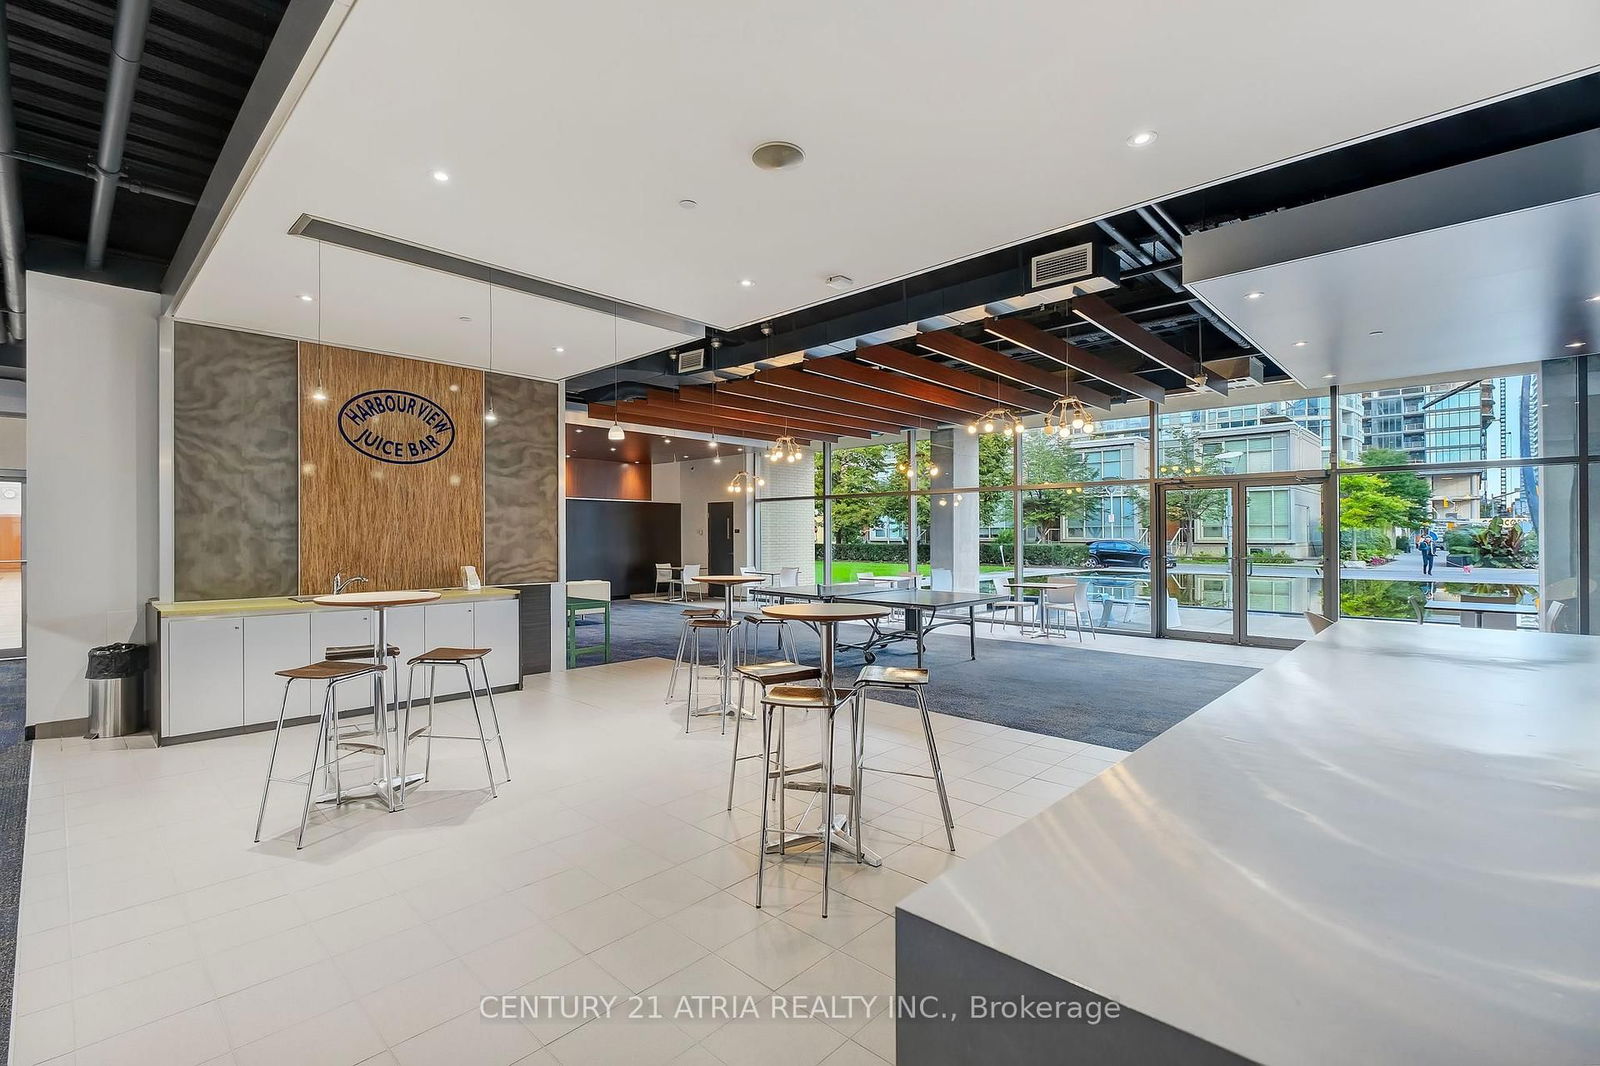
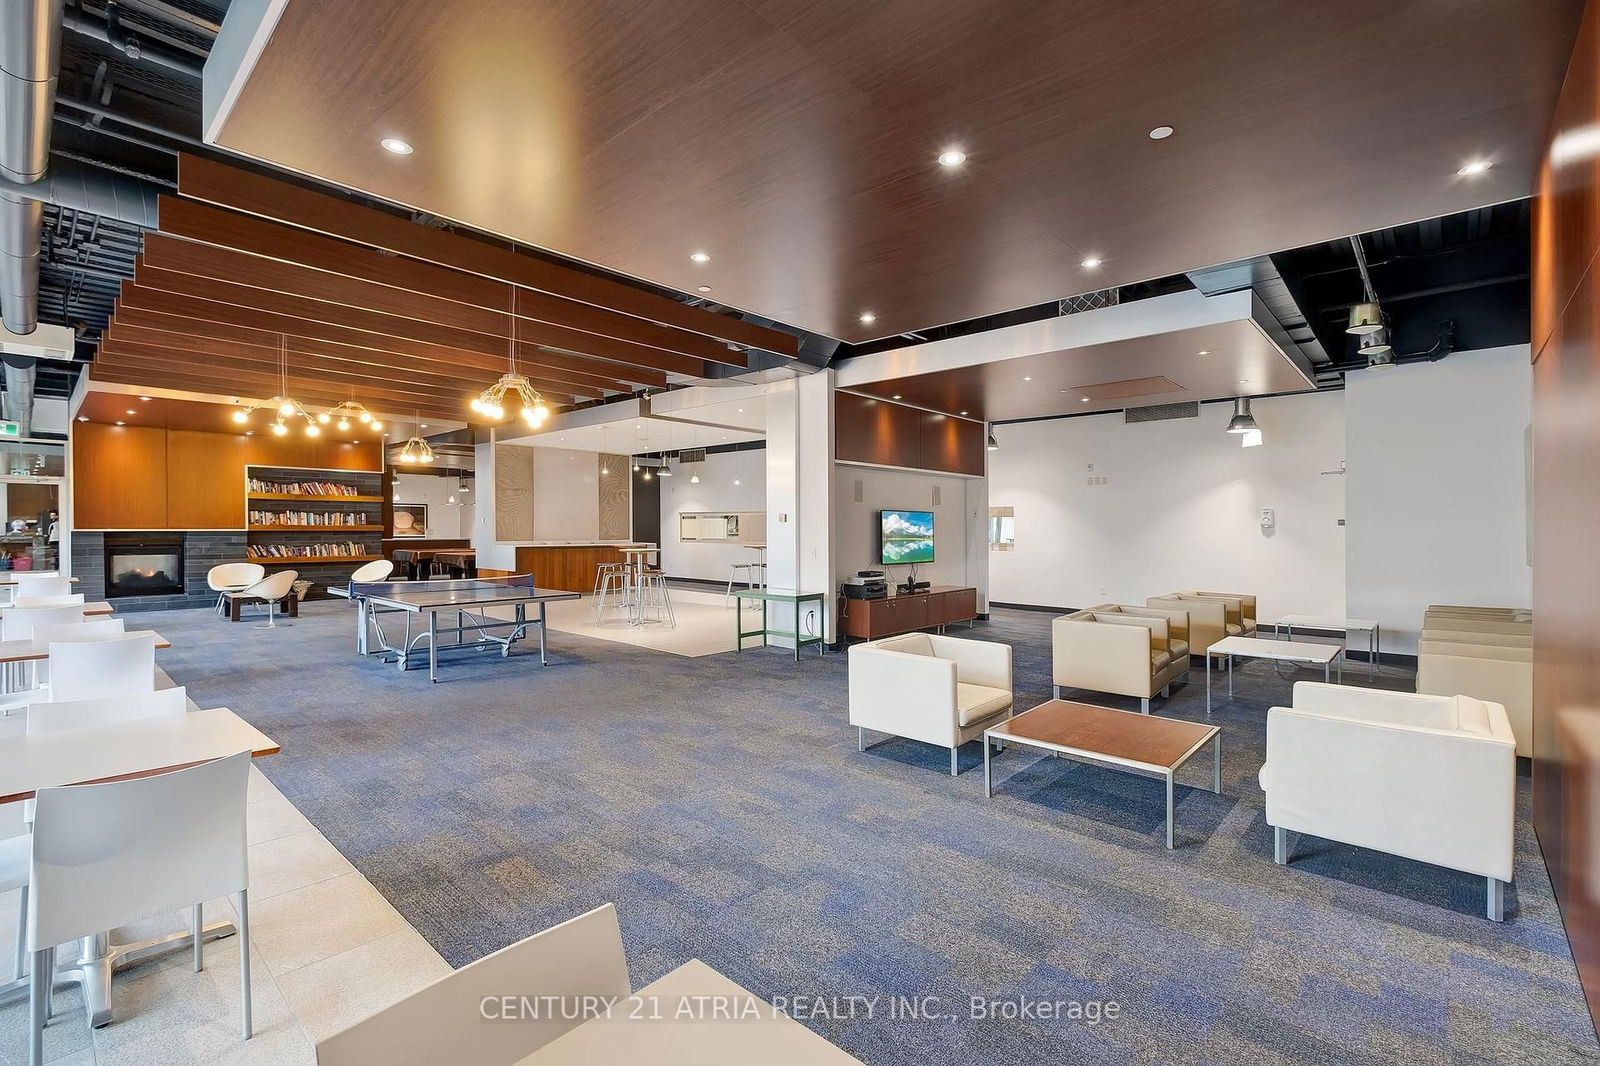
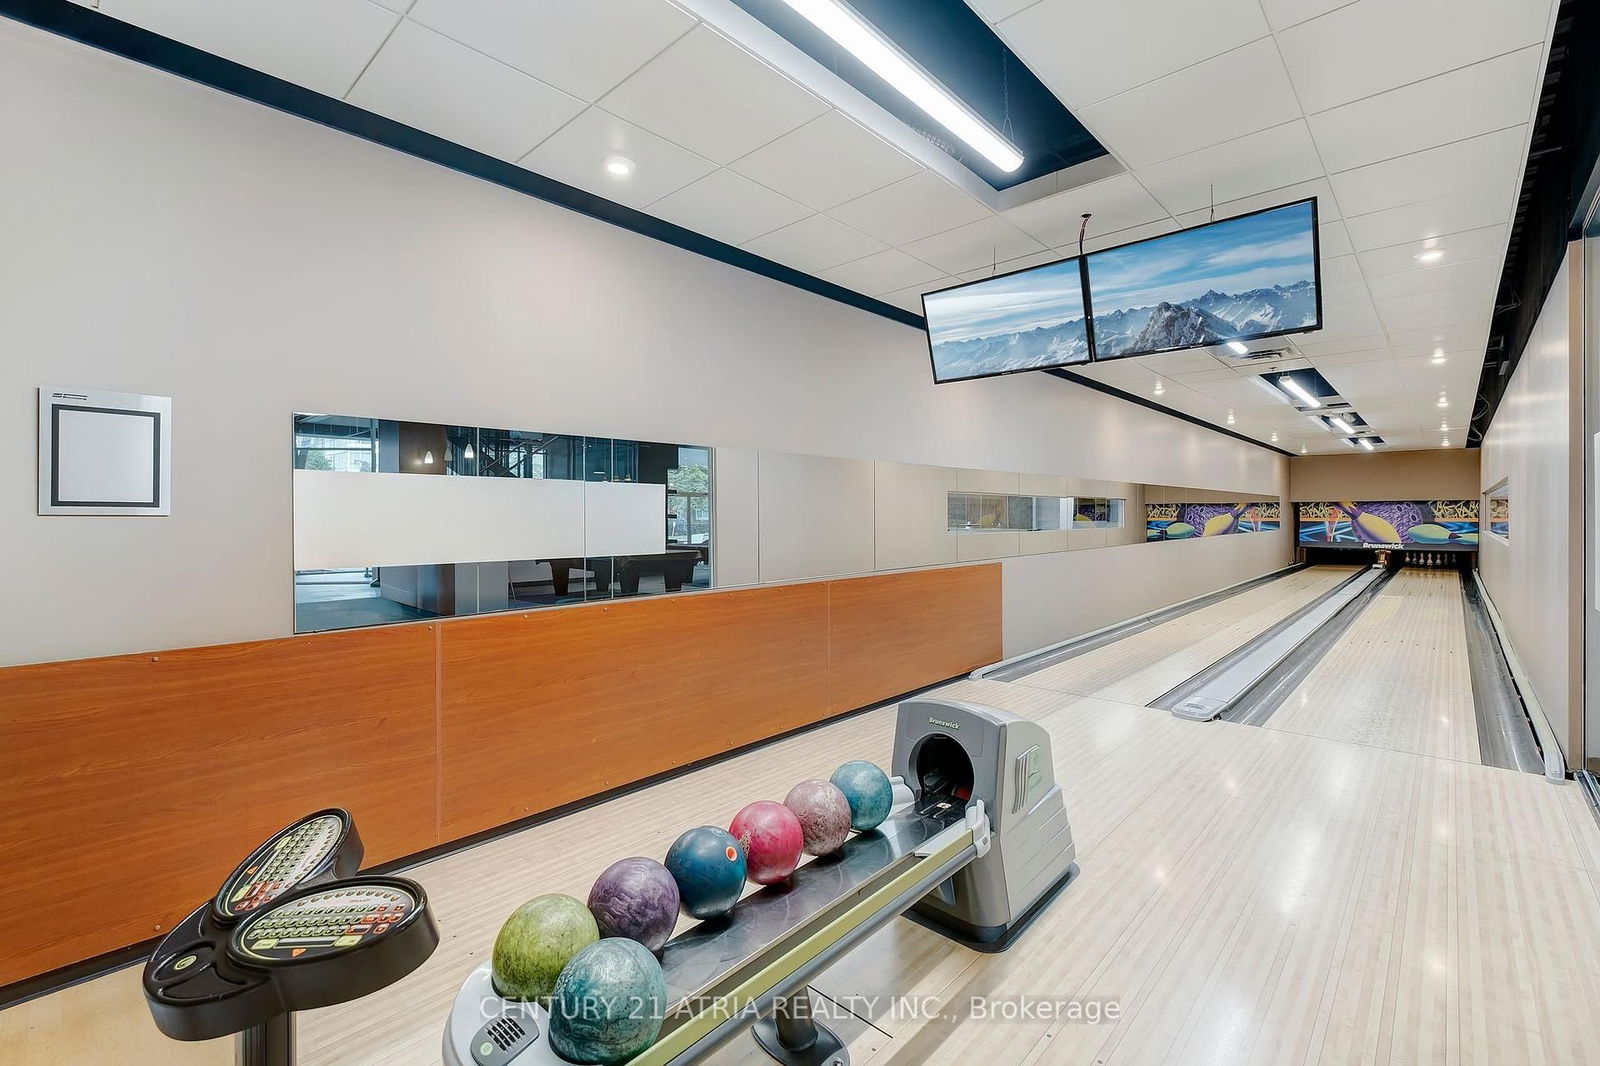
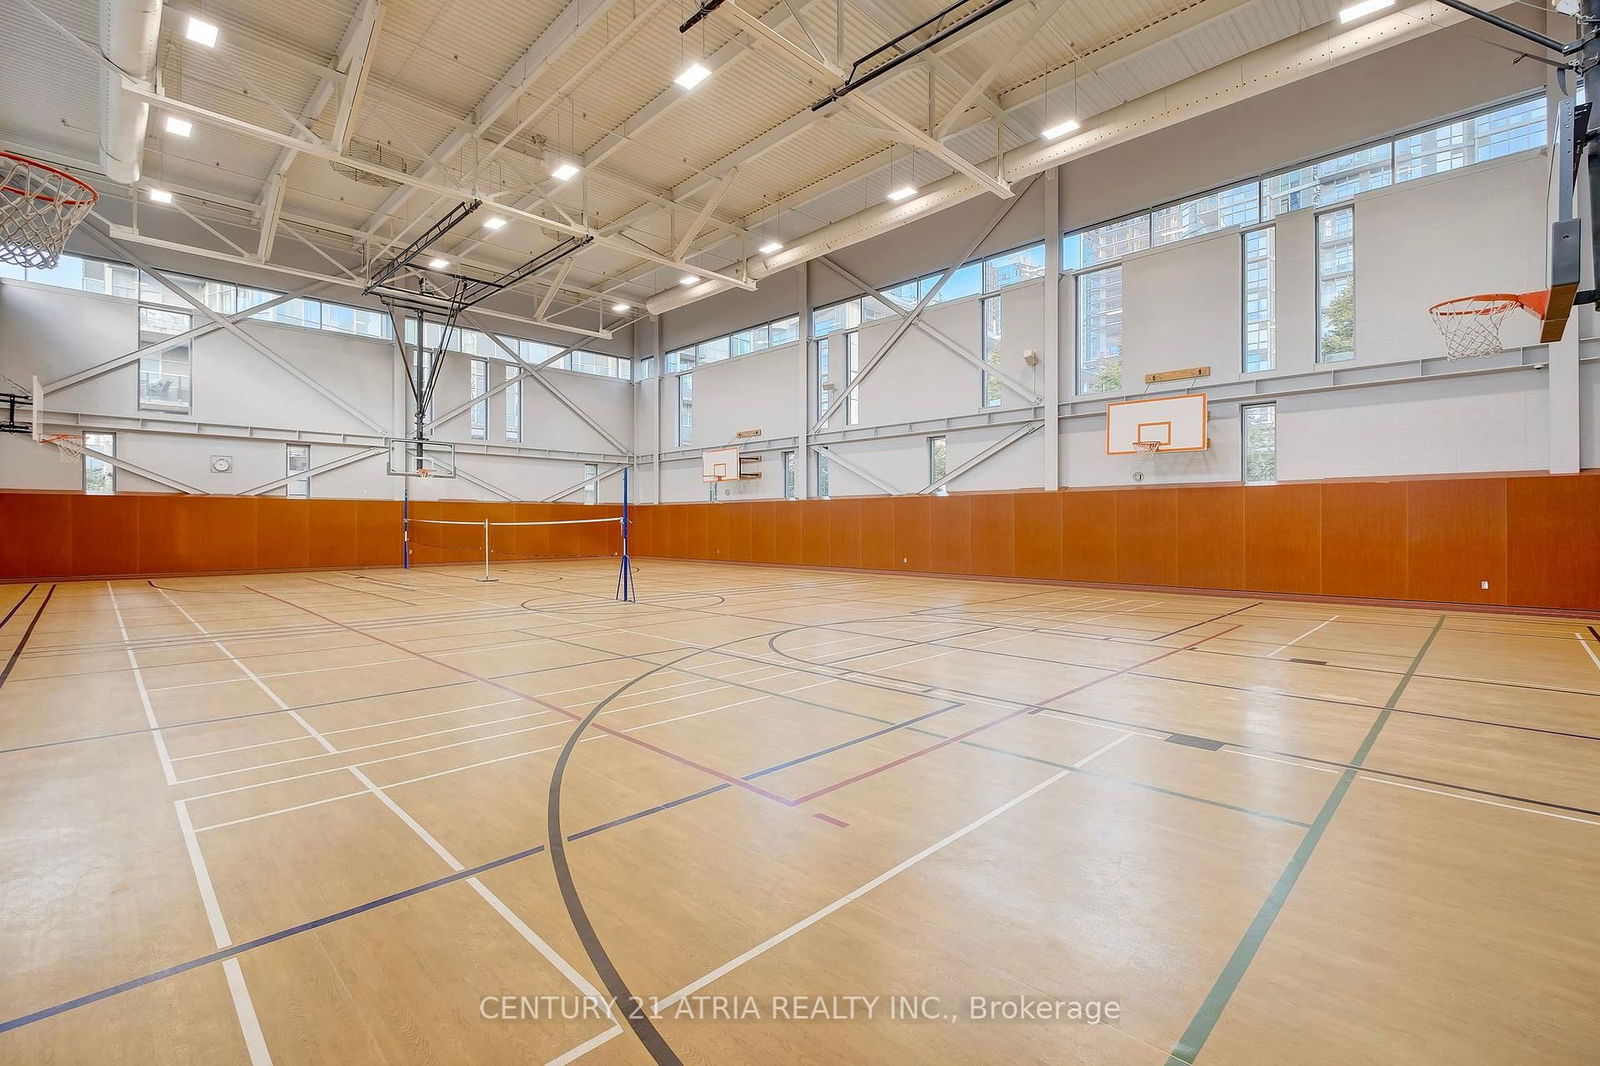
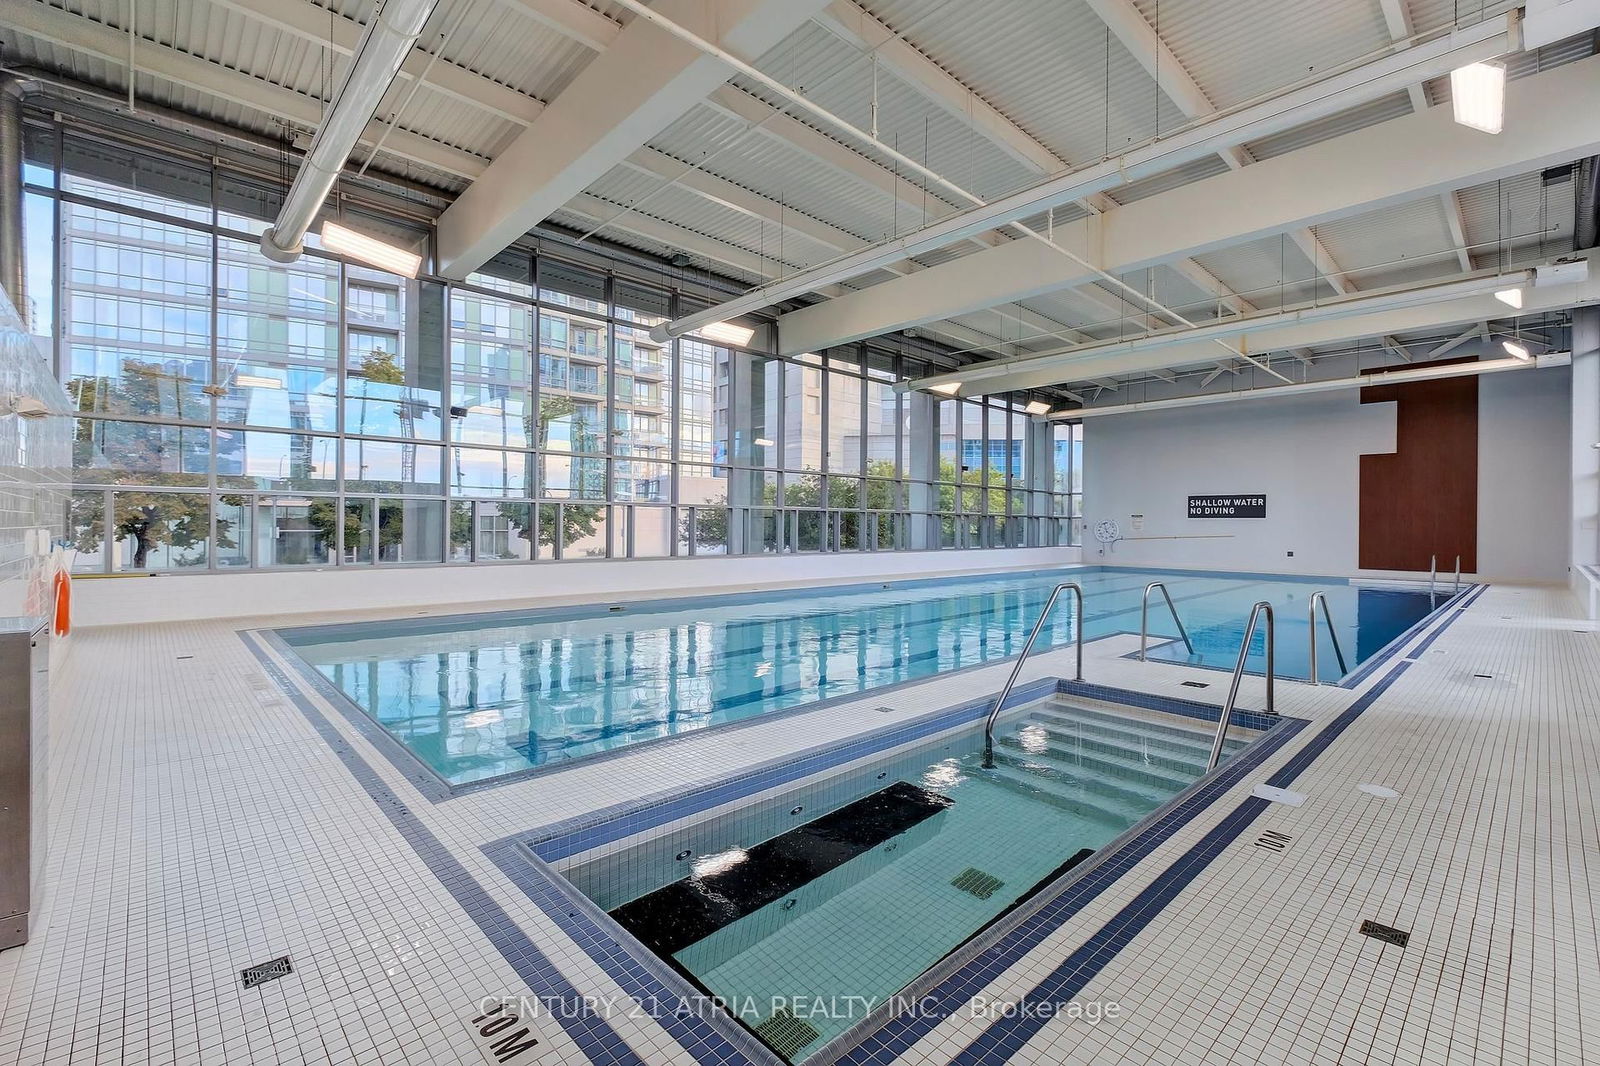
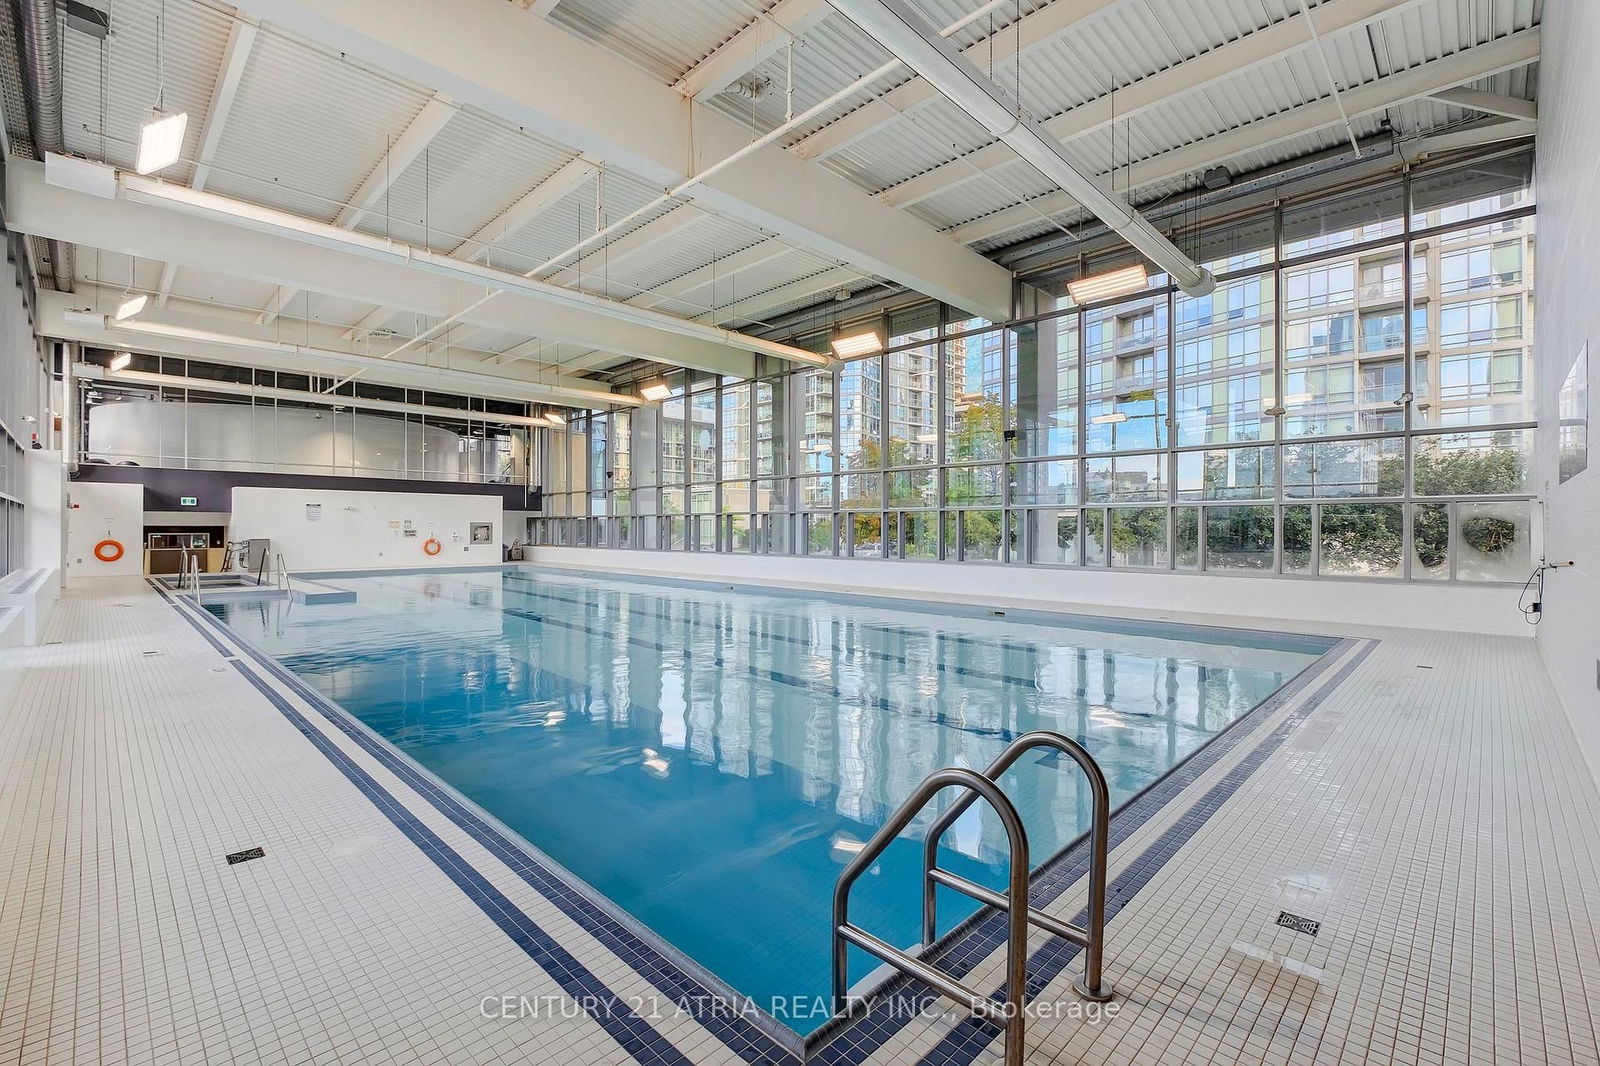
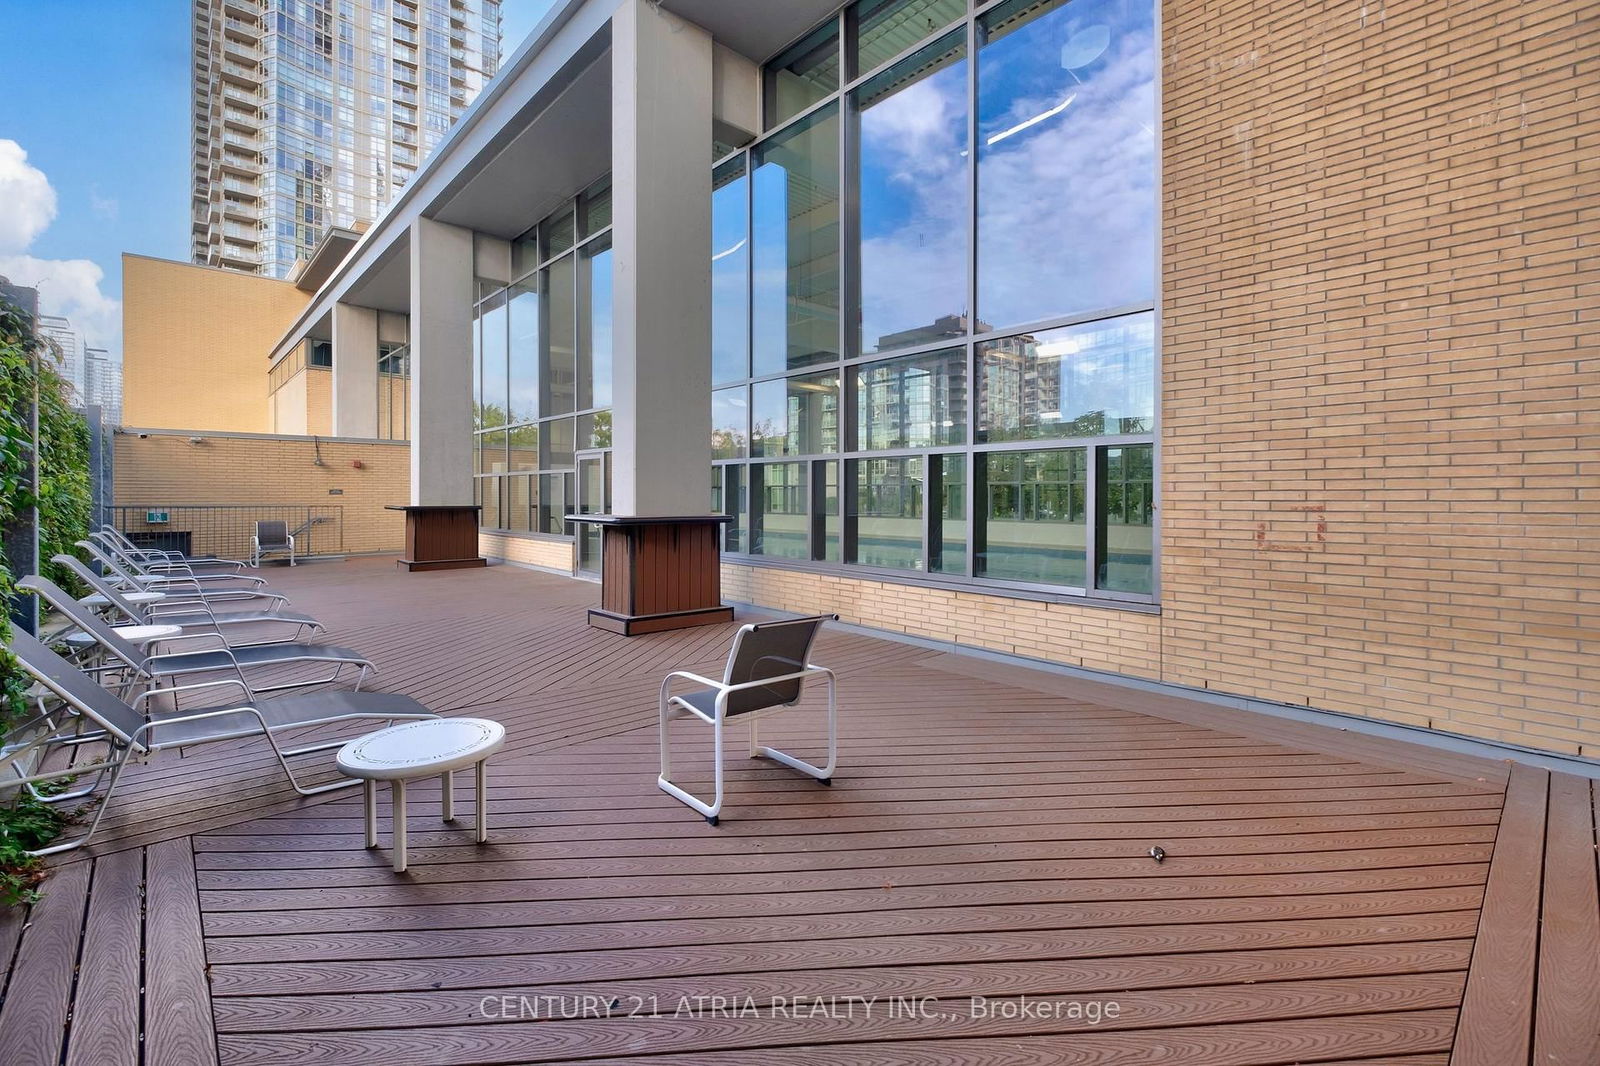
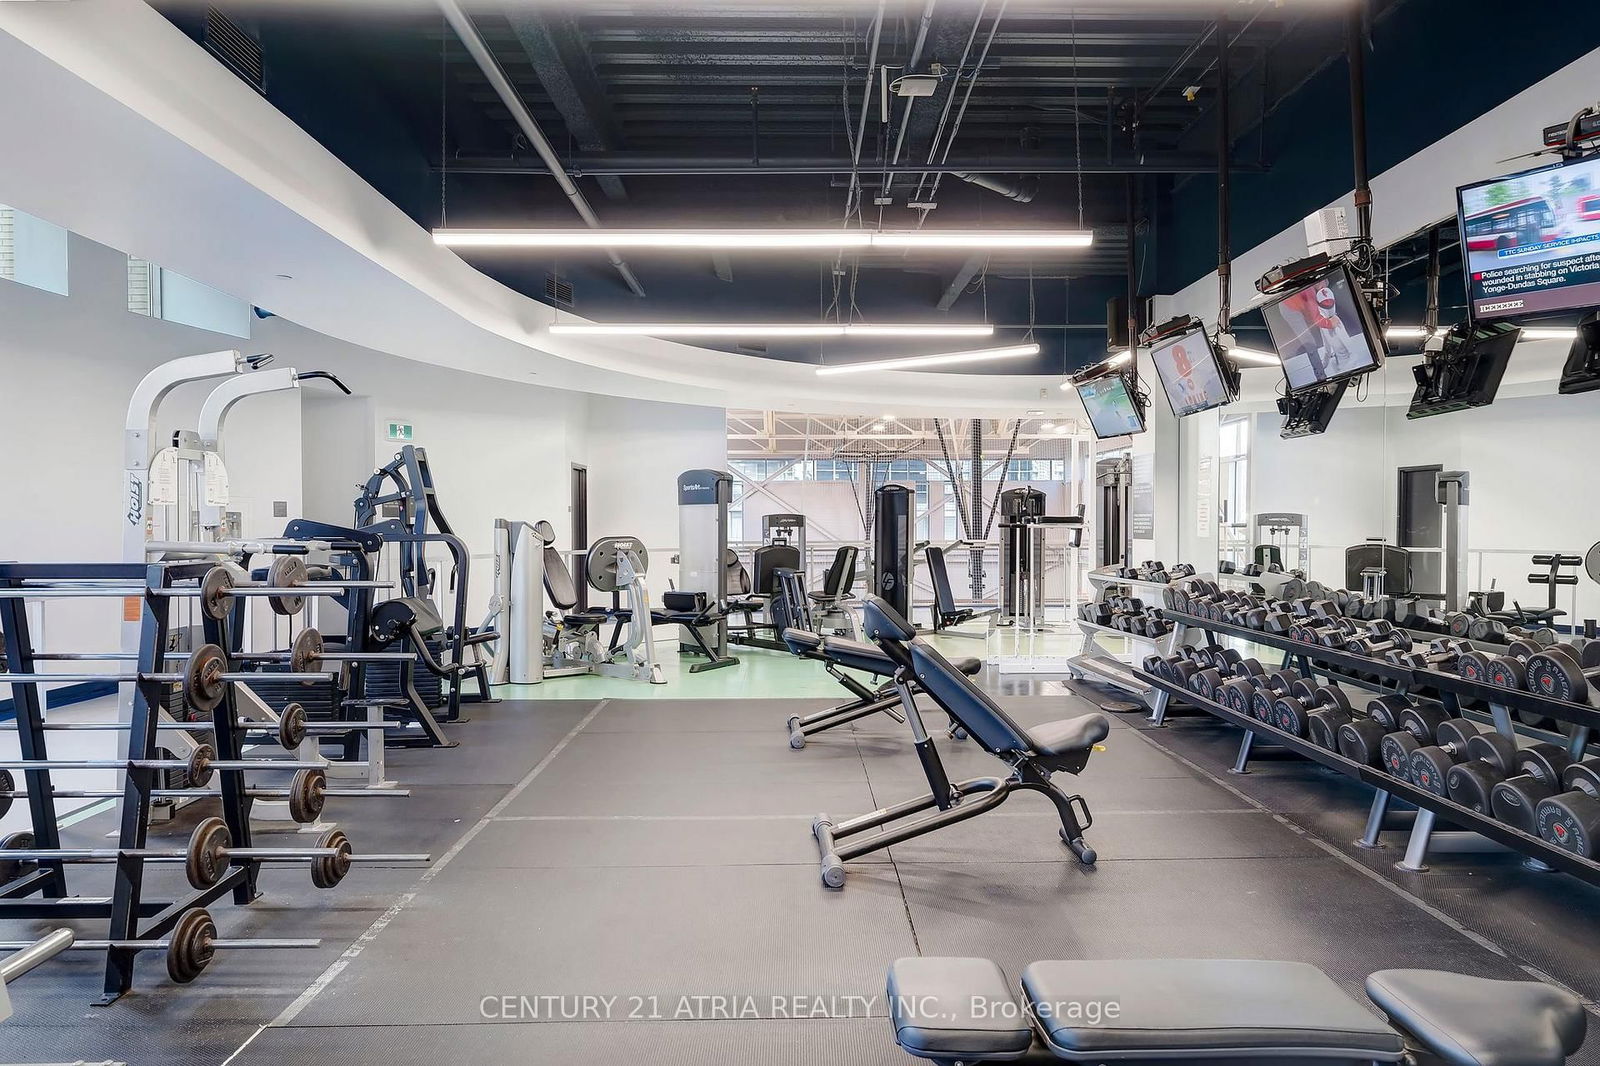
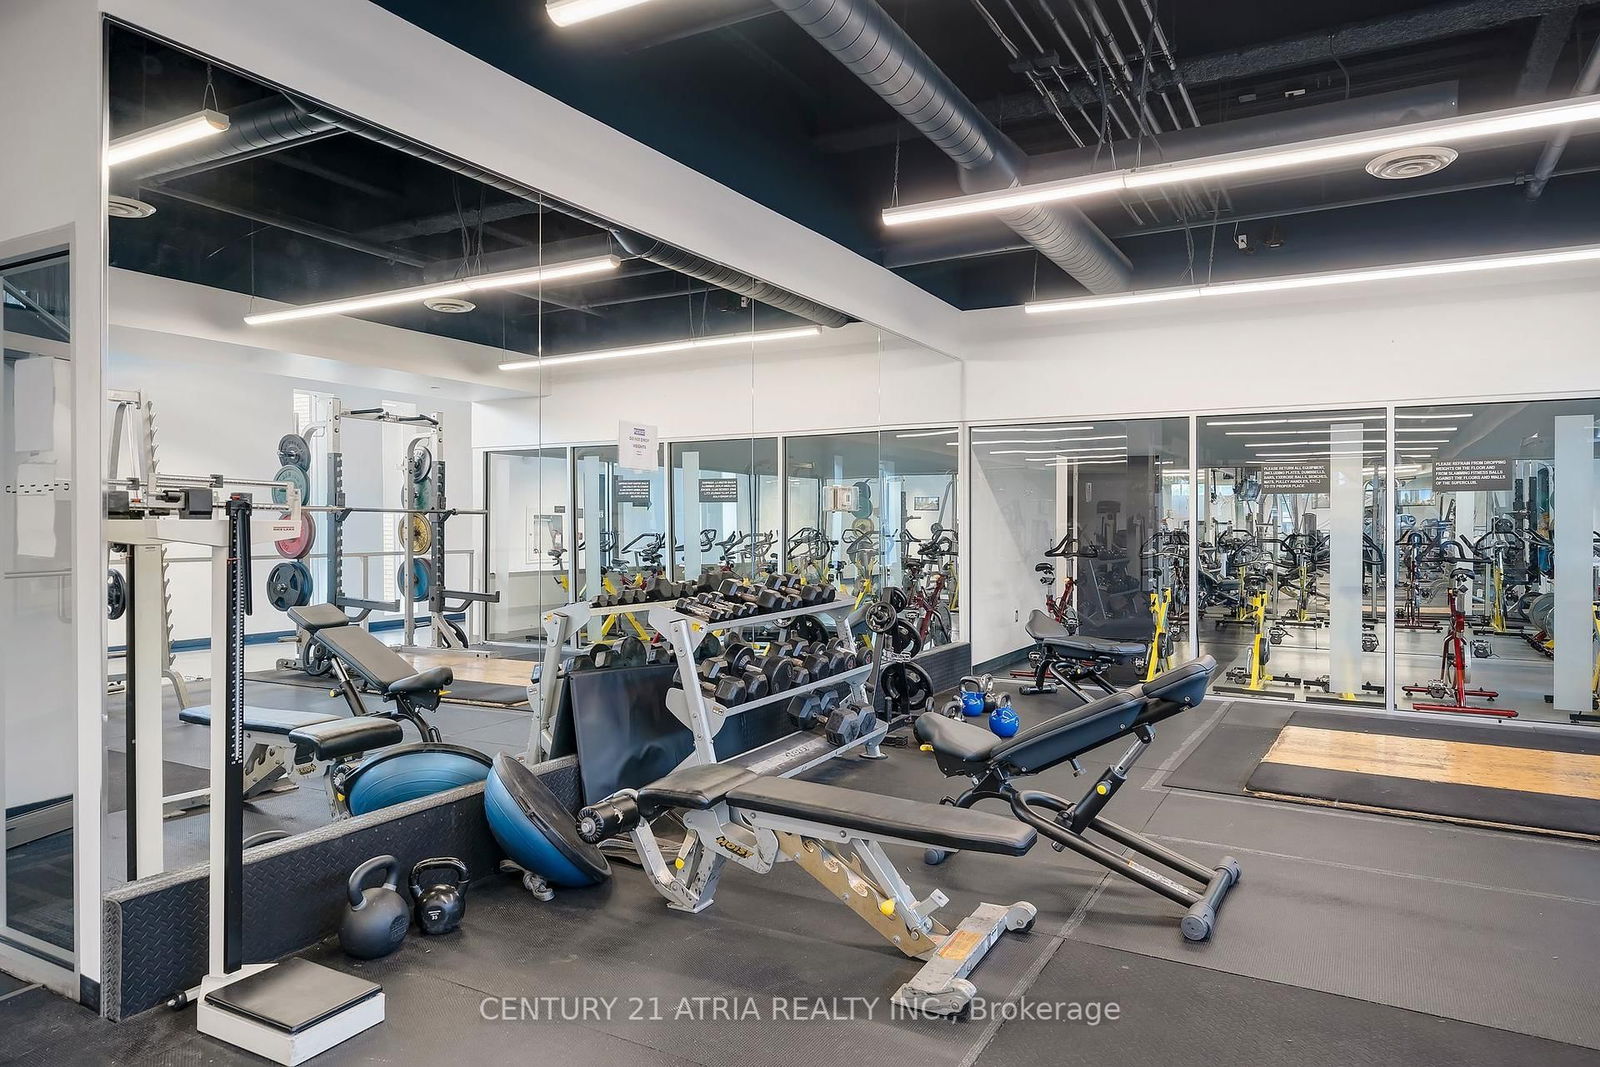
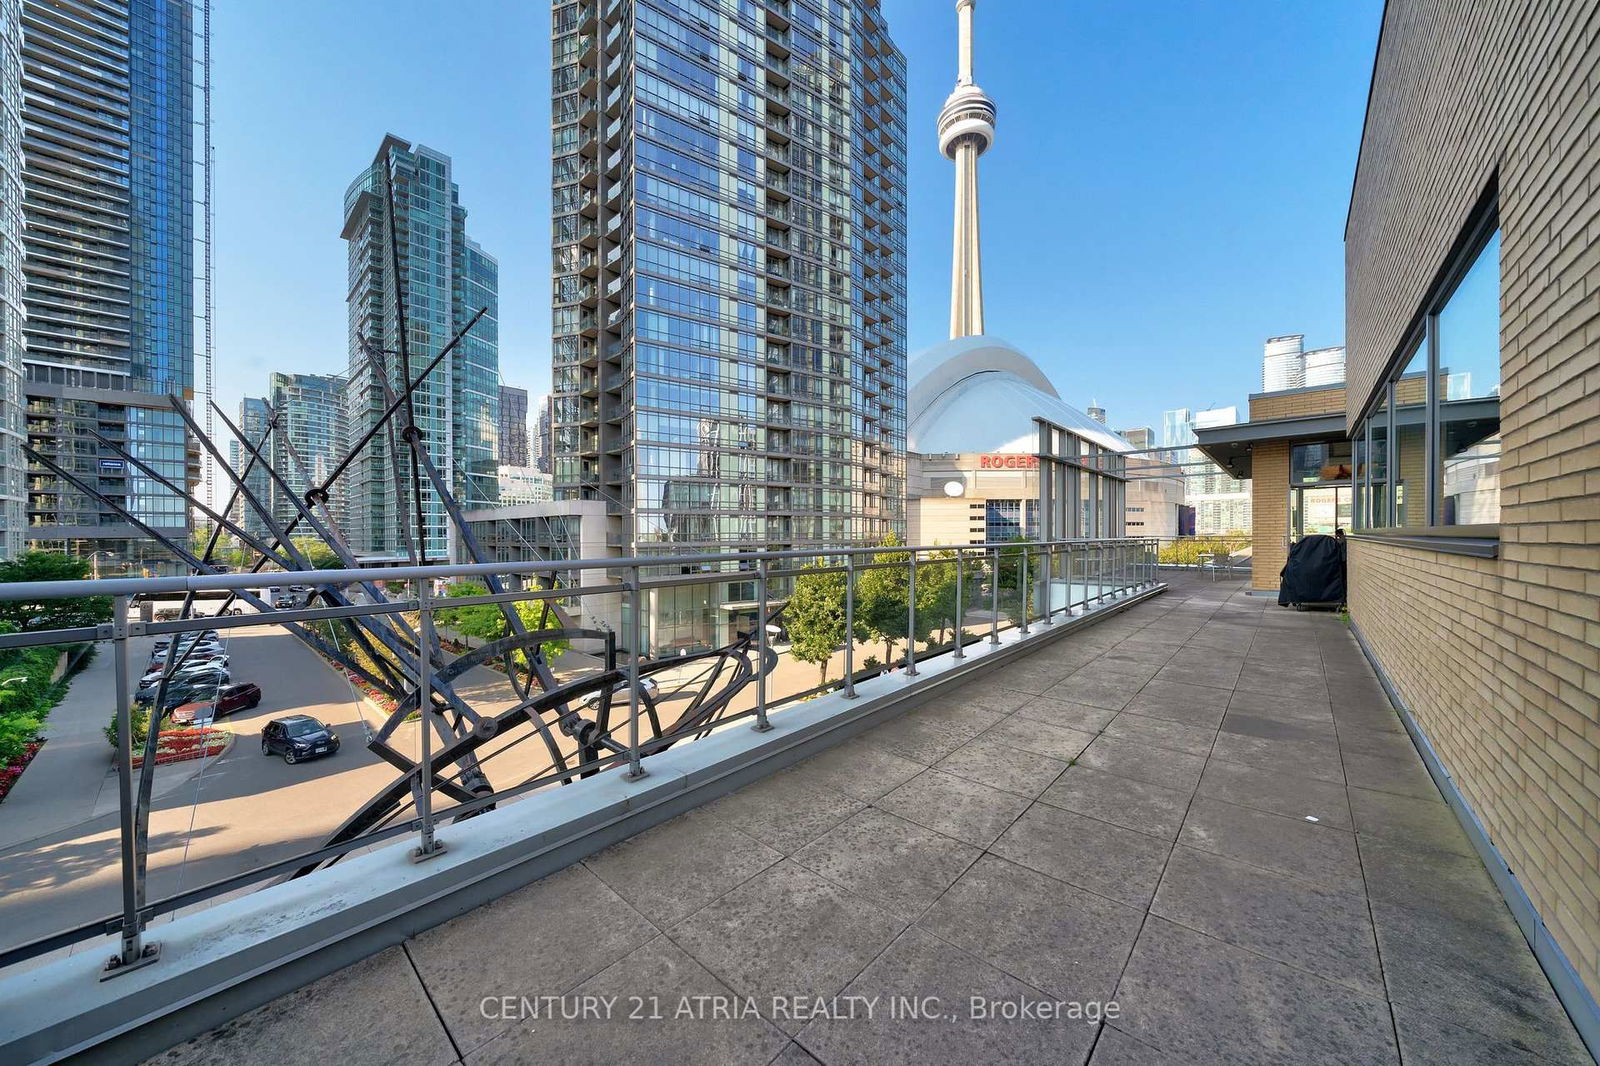
LIVE IN THE ultimate Toronto lifestyle in this hot spot. Feel the buzz from Rogers Centre, sip your coffee with a CN Tower backdrop, and stroll to the Entertainment District. Bike the lakeshore, hit up The Well for some dining & shopping, and zip around the GTA with ease on the TTC. This is Toronto living at its finest. This unit features a sleek 550-square-foot open-concept layout with a balcony. The building is packed with perks: 24-hour concierge, exclusive access to a top-notch recreational centre, including a gym, basketball court, bowling alley, indoor running track, swimming pool, rooftop patio, and more. Don't miss out - come check it out today and experience all the wonderful things for yourself!
century 21 atria realty inc.MLS® #C12001510
Amenities
Explore Neighbourhood
Similar Listings
Demographics
Based on the dissemination area as defined by Statistics Canada. A dissemination area contains, on average, approximately 200 – 400 households.
Price Trends
Maintenance Fees
Building Trends At Harbour View Estates I Condos
Days on Strata
List vs Selling Price
Offer Competition
Turnover of Units
Property Value
Price Ranking
Sold Units
Rented Units
Best Value Rank
Appreciation Rank
Rental Yield
High Demand
Transaction Insights at 9 Spadina Avenue
| Studio | 1 Bed | 1 Bed + Den | 2 Bed | 2 Bed + Den | 3 Bed | 3 Bed + Den | |
|---|---|---|---|---|---|---|---|
| Price Range | No Data | $503,500 - $585,000 | $570,000 - $735,000 | No Data | $1,300,000 | No Data | No Data |
| Avg. Cost Per Sqft | No Data | $1,023 | $986 | No Data | $783 | No Data | No Data |
| Price Range | No Data | $2,250 - $3,250 | $2,400 - $3,300 | $3,600 | $4,000 - $6,700 | No Data | No Data |
| Avg. Wait for Unit Availability | No Data | 129 Days | 21 Days | 662 Days | 71 Days | 766 Days | No Data |
| Avg. Wait for Unit Availability | No Data | 50 Days | 11 Days | 879 Days | 43 Days | 185 Days | No Data |
| Ratio of Units in Building | 1% | 13% | 66% | 2% | 18% | 1% | 2% |
Transactions vs Inventory
Total number of units listed and leased in CityPlace
