Maintenance Fees
The Metropole Condos vs The St. Lawrence Area


Condo
Immediately
1 Year
Yes
None
No
East
None
Main
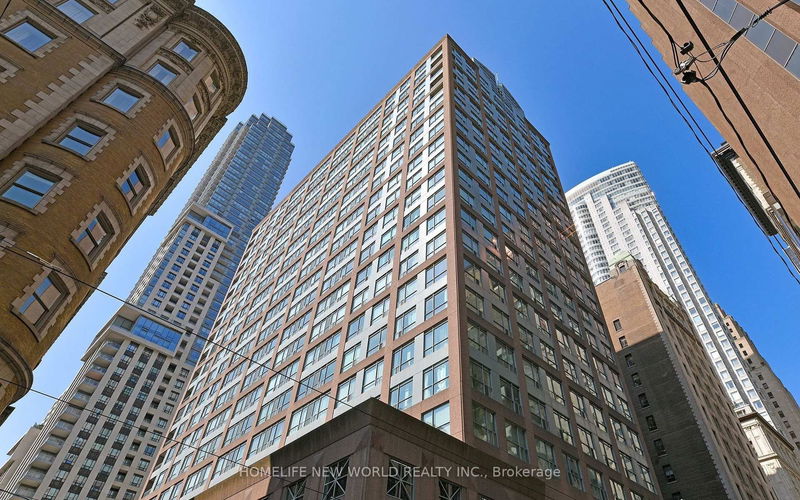
Heart of DOWNTOWN! (Hydro, Water, and CAC INCLUDED!) This bachelor suite is perfectly located in Torontos Financial & Historical District, just steps from your office, King Subway Station, streetcars, and the PATH. Walk to St. Lawrence Market, the Entertainment District, theatres, ACC, Rogers Centre, and the waterfront.The open-concept studio boasts massive windows, flooding the space with natural light and enhancing its spacious feel. Enjoy a modern kitchen, in-suite laundry, and a smart, functional layout designed for urban living.Building amenities include 24-hour concierge, a pool, gym, rooftop terrace, and more! A prime location with unbeatable convenience and value.
ExtrasHydro, Water, and CAC INCLUDED!
homelife new world realty inc.MLS® #C11987816
Laminate, Large Window
Based on the dissemination area as defined by Statistics Canada. A dissemination area contains, on average, approximately 200 – 400 households.
| Studio | 1 Bed | 1 Bed + Den | 2 Bed | 2 Bed + Den | 3 Bed | 3 Bed + Den | |
|---|---|---|---|---|---|---|---|
| Price Range | $460,000 | No Data | $670,000 - $800,000 | $700,000 - $895,000 | No Data | No Data | No Data |
| Avg. Cost Per Sqft | $1,266 | No Data | $882 | $885 | No Data | No Data | No Data |
| Price Range | $1,900 - $2,100 | $2,275 - $2,600 | $2,750 - $3,150 | $3,000 - $4,600 | $3,150 - $3,800 | No Data | No Data |
| Avg. Wait for Unit Availability | 333 Days | 217 Days | 163 Days | 120 Days | 214 Days | 78 Days | No Data |
| Avg. Wait for Unit Availability | 64 Days | 69 Days | 63 Days | 36 Days | 125 Days | No Data | No Data |
| Ratio of Units in Building | 15% | 17% | 24% | 31% | 12% | 2% | 1% |
Total number of units listed and leased in St. Lawrence
