Maintenance Fees
543 Richmond vs The Queen West Area


Condo
May 1, 2025
1 Year
No
Balcony
No
West
None
Main
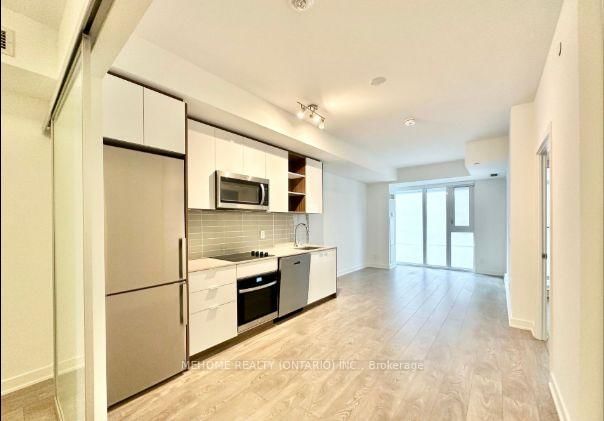
Location! Location! 543 Richmont St By Pemberton At Downtown Core Location! In The Heart Of Downtown Toronto, Where You Can Immerse Yourself In The Vibrant Lifestyle Of King West. 9Ft Smooth Ceilings, Wide Plank Laminate Flooring, Stainless Steel Kitchen Appliances, Quartz Counter Tops. Just A Stone's Throw Away From Loblaws, Farmboy, Coffee Shops, Gyms, And Restaurants. Only A 5-minute Drive To Union Station/Rogers Centre Or A Brisk 25-Minute Walk For The Active types. Very Spacious & Functional Layout Plus +Den (Den Can Be 2nd Bedroom), 2Bath W/Balcony. West Exposure. Enjoyed All Within Walking Distance. Never Be Far Away From Anything Again. There's So Much To See, Do Here That Really Have To Live Here To Get It! Must See!
ExtrasS/S Fridge, Dishwasher, Oven, Cooktop, Hood, Microwave, Washer & Dryer. All Existing Light Fixtures, All Existing Window Coverings.
mehome realty (ontario) inc.MLS® #C12009246
Laminate, Open Concept, Walkout To Balcony
Laminate, Open Concept, Combined with Living
Laminate, Stainless Steel Appliances, Stone Counter
4 Piece Ensuite, Closet, Window
Laminate, Closet, Window
Based on the dissemination area as defined by Statistics Canada. A dissemination area contains, on average, approximately 200 – 400 households.
| Studio | 1 Bed | 1 Bed + Den | 2 Bed | 2 Bed + Den | 3 Bed | 3 Bed + Den | |
|---|---|---|---|---|---|---|---|
| Price Range | No Data | $595,000 | $542,000 - $688,888 | No Data | No Data | No Data | No Data |
| Avg. Cost Per Sqft | No Data | $1,081 | $980 | No Data | No Data | No Data | No Data |
| Price Range | $1,800 - $2,000 | $2,000 - $2,600 | $2,100 - $4,450 | $2,500 - $3,500 | $3,100 - $3,600 | $3,650 - $4,795 | $4,400 - $4,800 |
| Avg. Wait for Unit Availability | No Data | 78 Days | 76 Days | No Data | No Data | No Data | No Data |
| Avg. Wait for Unit Availability | 13 Days | 8 Days | 3 Days | 14 Days | 24 Days | 15 Days | 15 Days |
| Ratio of Units in Building | 4% | 16% | 44% | 11% | 7% | 7% | 2% |
Total number of units listed and leased in Queen West
