Maintenance Fees
Central Condos vs The Queen West Area


Condo
$360/mth
$0 (2025)
$1,000 - $1,198/sqft
Balcony
None
West
To Be Arranged
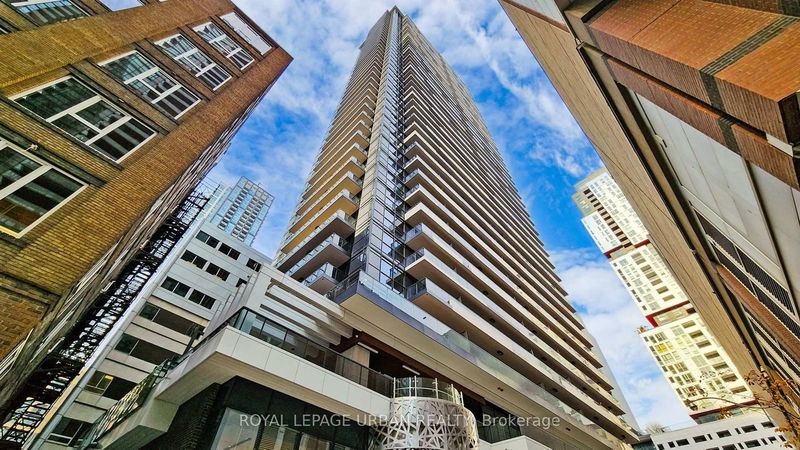
Welcome to a Brand New 475 Sqft + 60 Sqft Balcony Central Condos Unit in the Heart of Torontos Entertainment District and Tech Hub. Featuring Sleek Modern Design with a Functional Layout in the Heart of All the Action but Preserving Privacy for an Urban Professional. Luminous Unit with 9 Ceilings and Large West-Facing Floor-to-Ceiling Windows With Unobstructed Views With Stunning Sunsets. Very spacious Bedroom Features Built-In Closet Organizers, Fits 2 Night Stands & Can Easily Add Desk or Dresser. High-end appliances, Kohler/Grohe Fixtures, Roller Shade Window Coverings, Balcony with Radiant Ceiling Heaters and Composite Decking. 100% Wifi Connectivity, Smart Thermostats. Walk + Transit Score 100, minutes to PATH, Close to St. Andrew and Osgoode TTC stations, U of T, TMU, OCAD, Hospitals, Easy Access to QEW. 24Hr Concierge, Visitor Parking, Gym, Pool, Hot Tub, Shared Workspace, Refrigerated Parcel Storage.
ExtrasRefrigerator, Dishwasher, Hood Fan, Cook top, Oven, Washer + Dryer.
royal lepage urban realtyMLS® #C11980728
Room dimensions are not available for this listing.
Based on the dissemination area as defined by Statistics Canada. A dissemination area contains, on average, approximately 200 – 400 households.
| Studio | 1 Bed | 1 Bed + Den | 2 Bed | 3 Bed | 3 Bed + Den | |
|---|---|---|---|---|---|---|
| Price Range | No Data | $615,000 | No Data | $699,000 - $888,000 | $1,038,000 - $1,130,000 | No Data |
| Avg. Cost Per Sqft | No Data | $1,317 | No Data | $1,230 | $1,063 | No Data |
| Price Range | $2,050 - $2,250 | $1,500 - $2,450 | $2,500 - $2,600 | $2,550 - $3,800 | $2,850 - $5,200 | No Data |
| Avg. Wait for Unit Availability | No Data | 481 Days | No Data | 156 Days | 210 Days | No Data |
| Avg. Wait for Unit Availability | 103 Days | 7 Days | 53 Days | 3 Days | 12 Days | No Data |
| Ratio of Units in Building | 1% | 21% | 4% | 54% | 16% | 1% |
Total number of units listed and sold in Queen West
