Listing History
Unit Highlights
Utilities Included
Utility Type
- Air Conditioning
- Central Air
- Heat Source
- Gas
- Heating
- Forced Air
Room Dimensions
Room dimensions are not available for this listing.
About this Listing
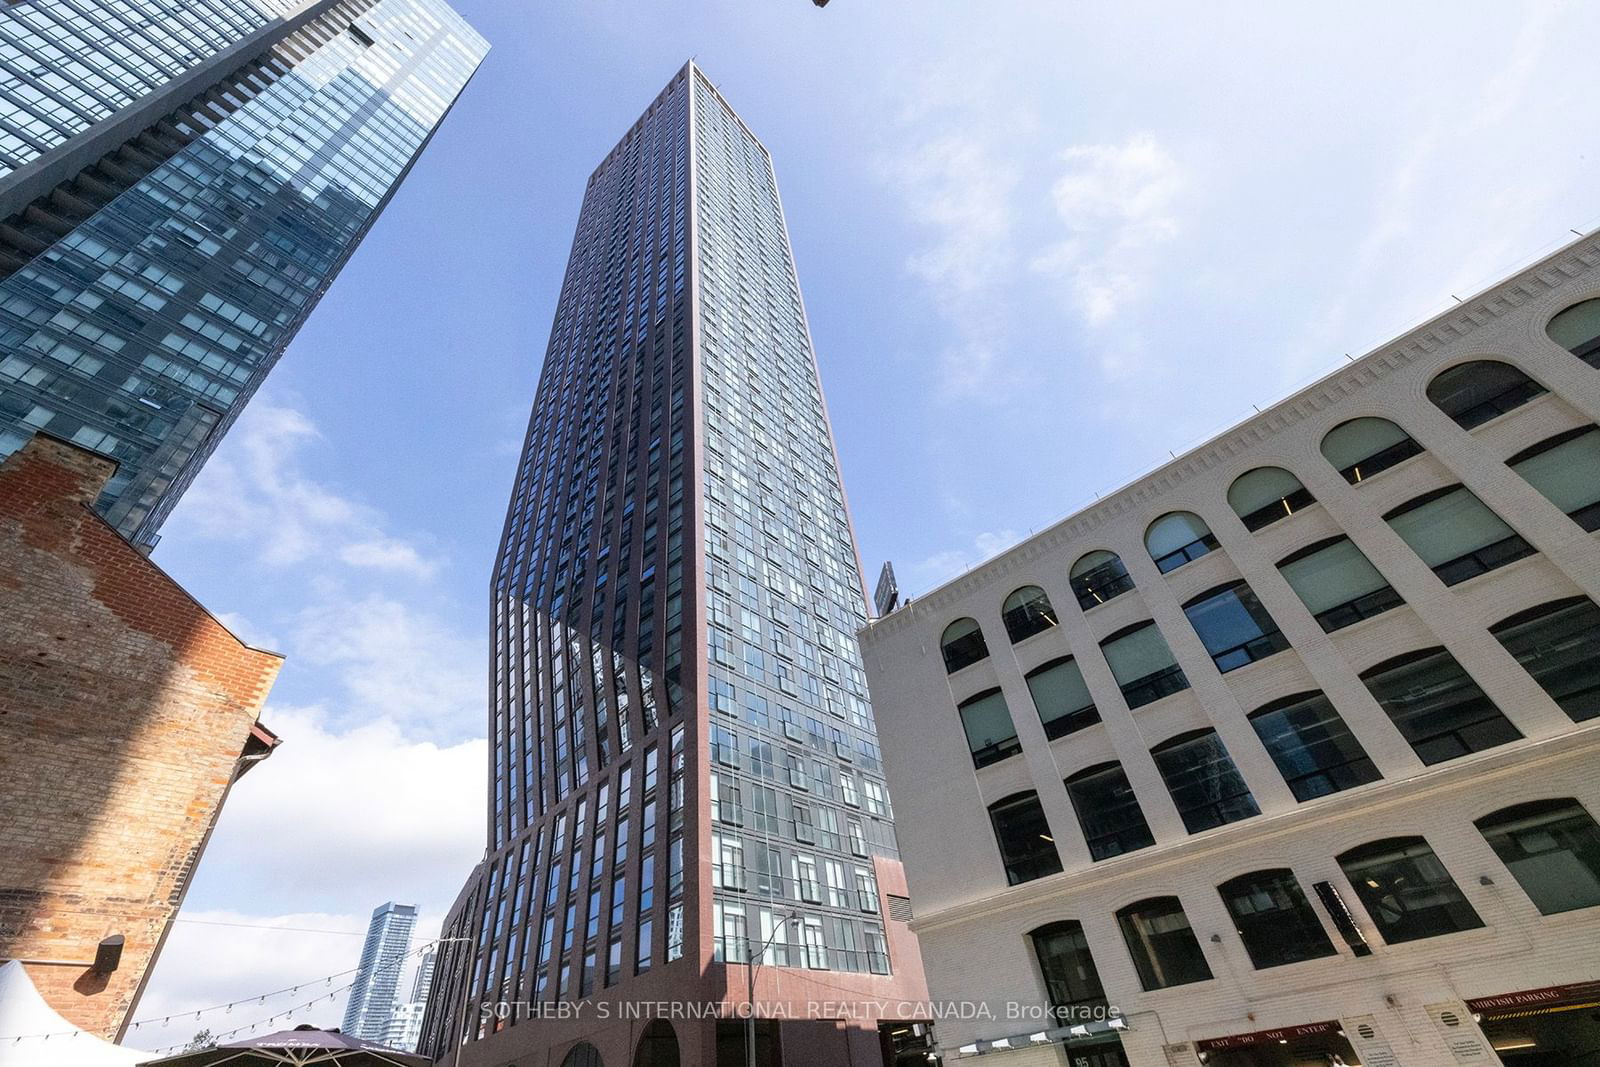
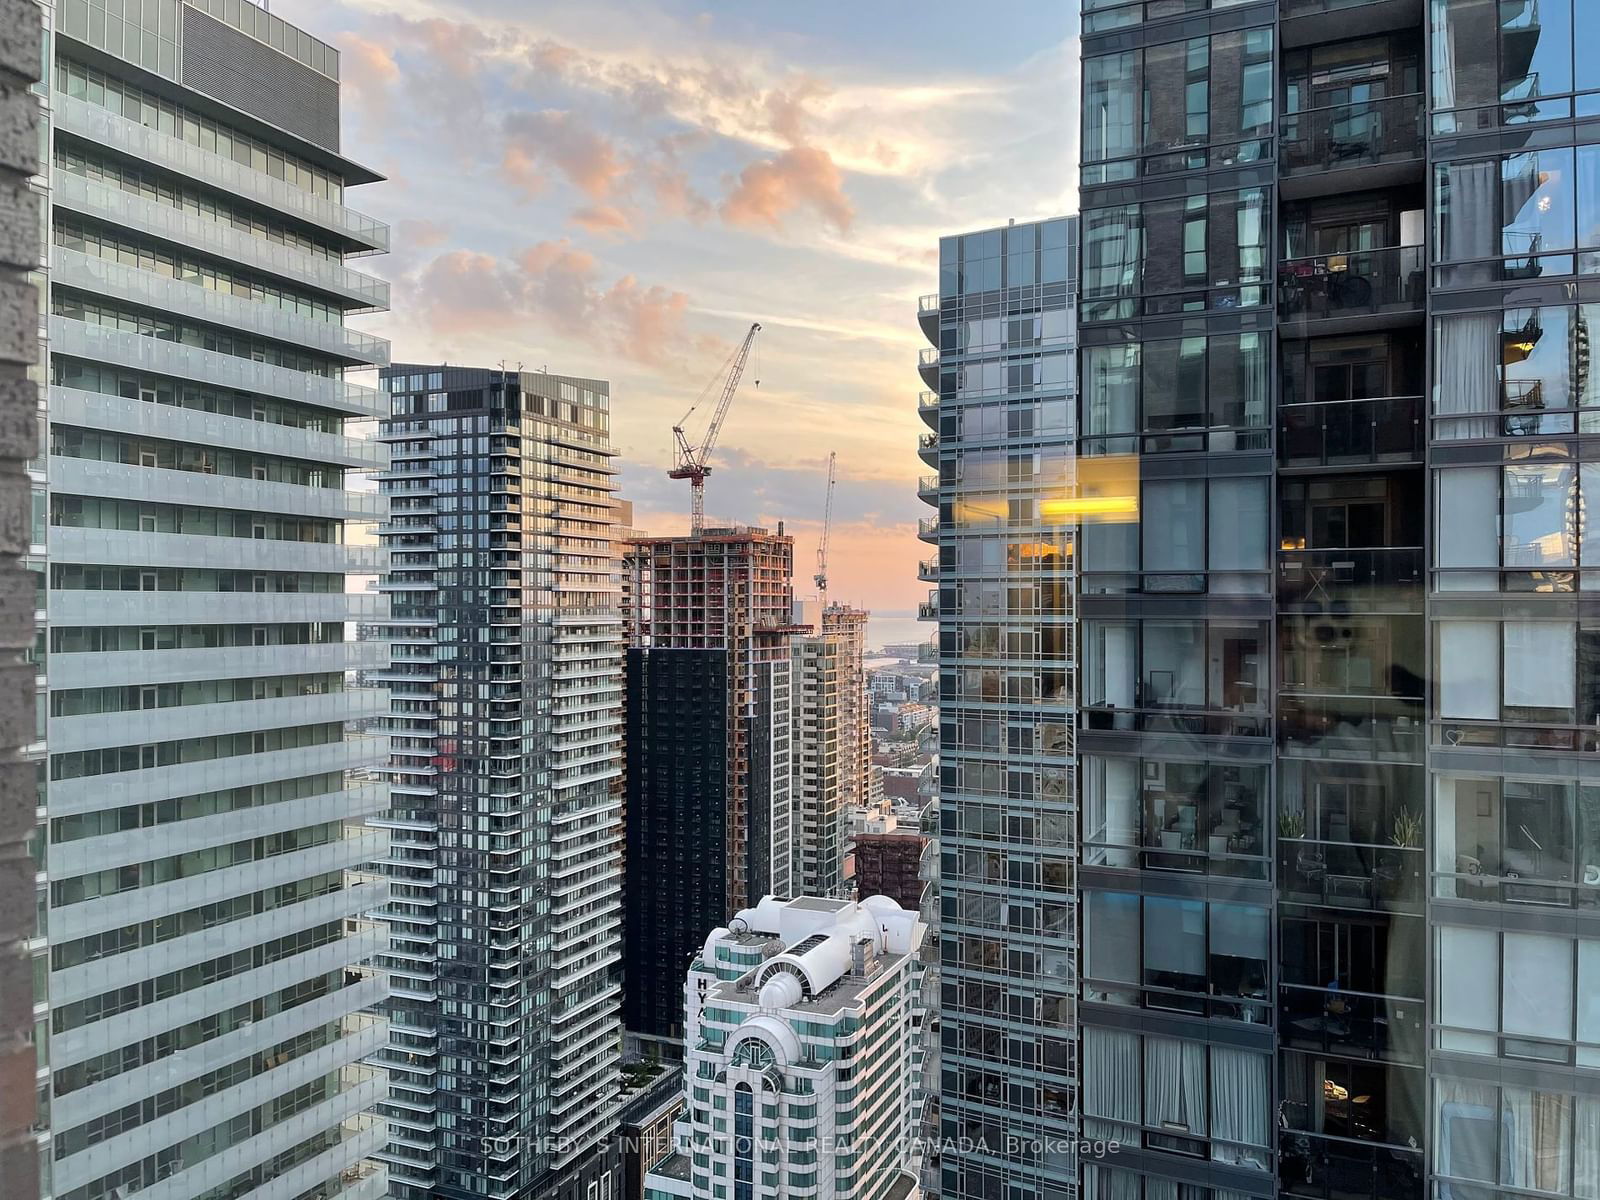
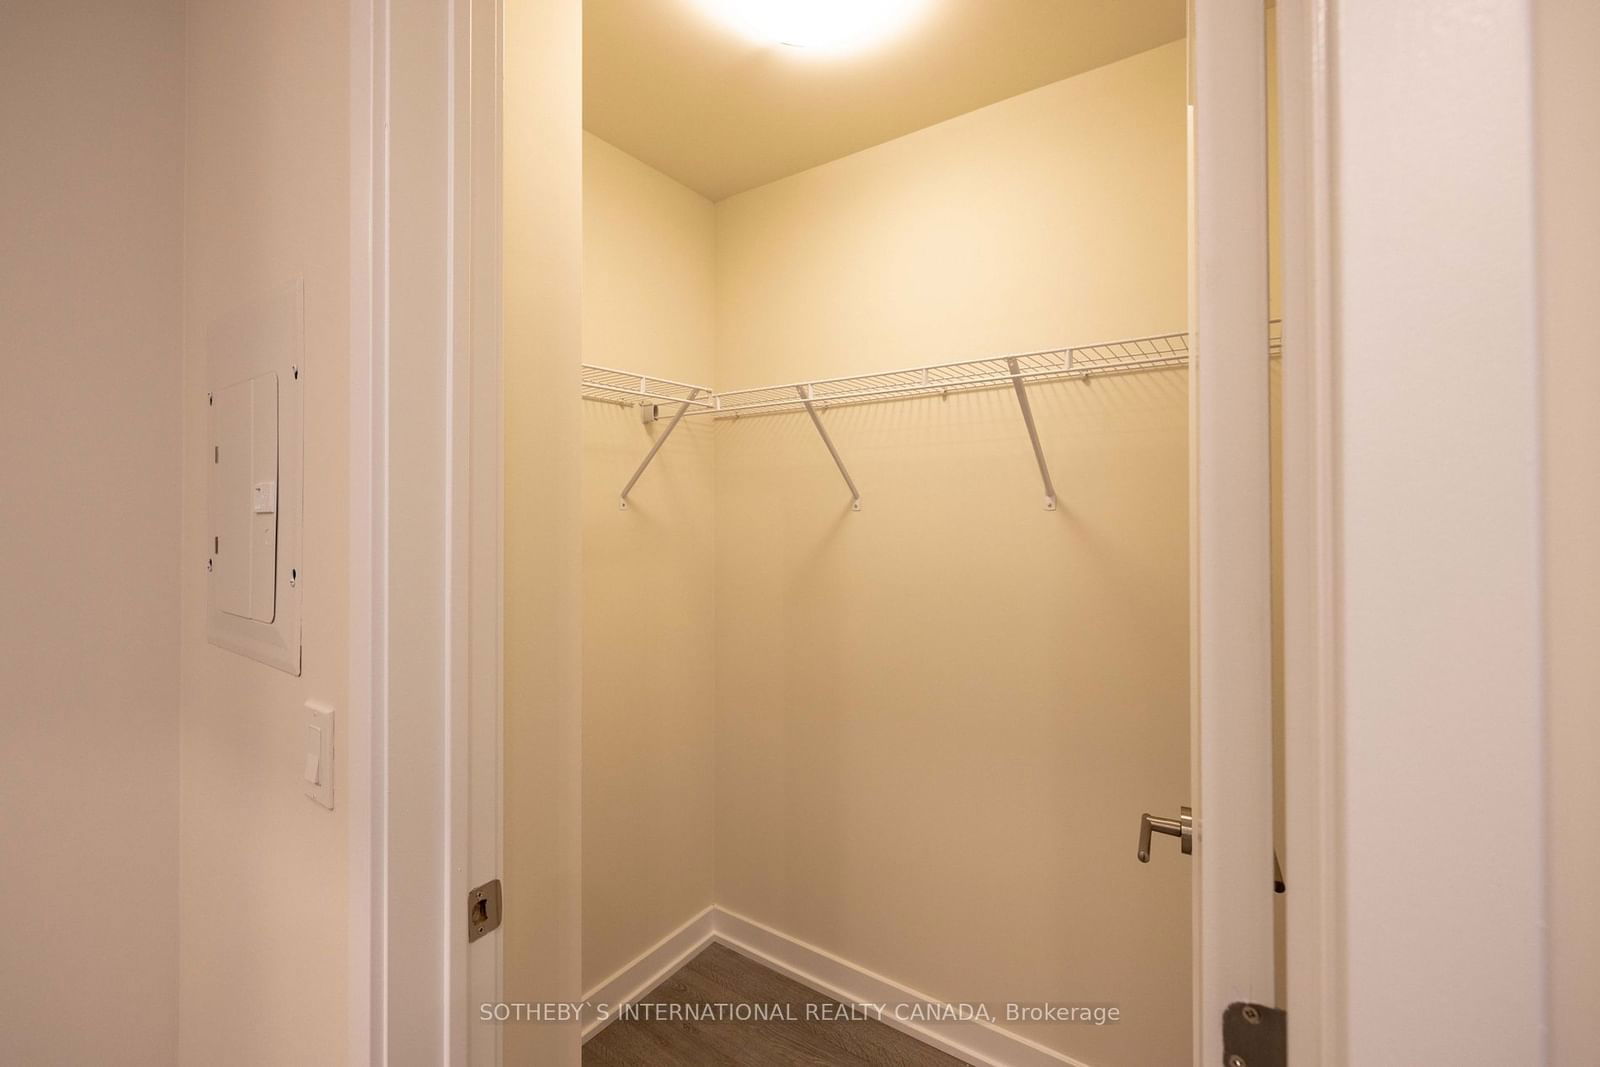
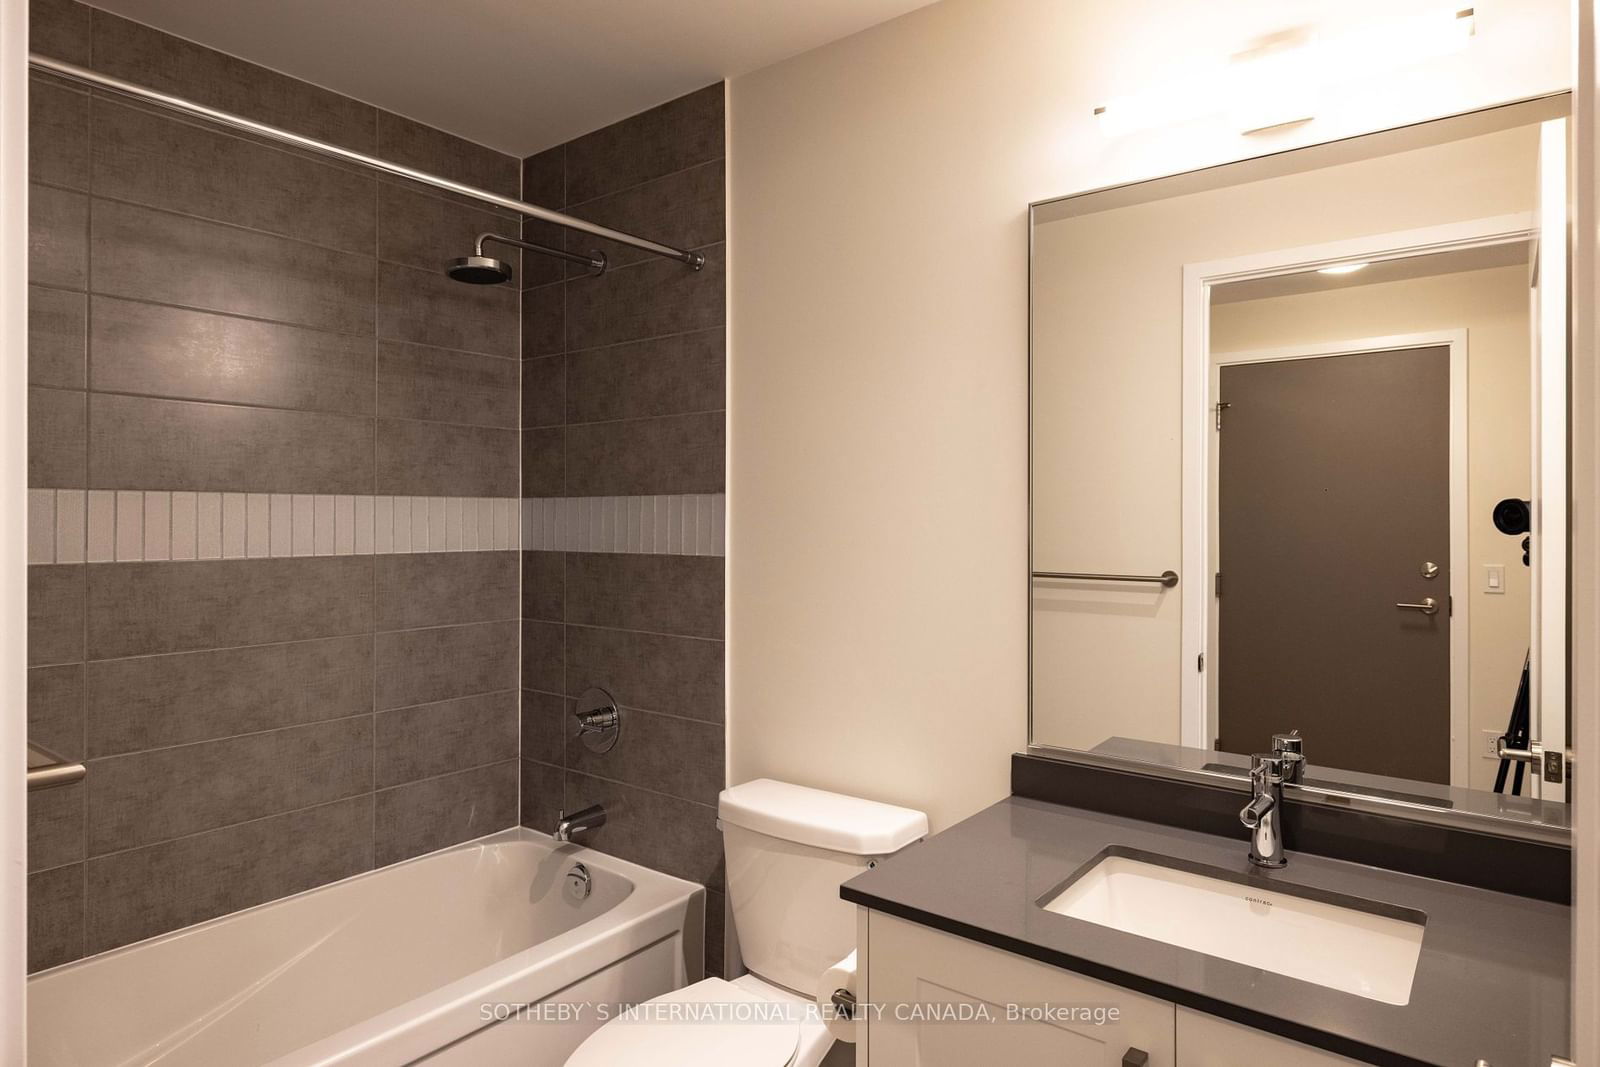
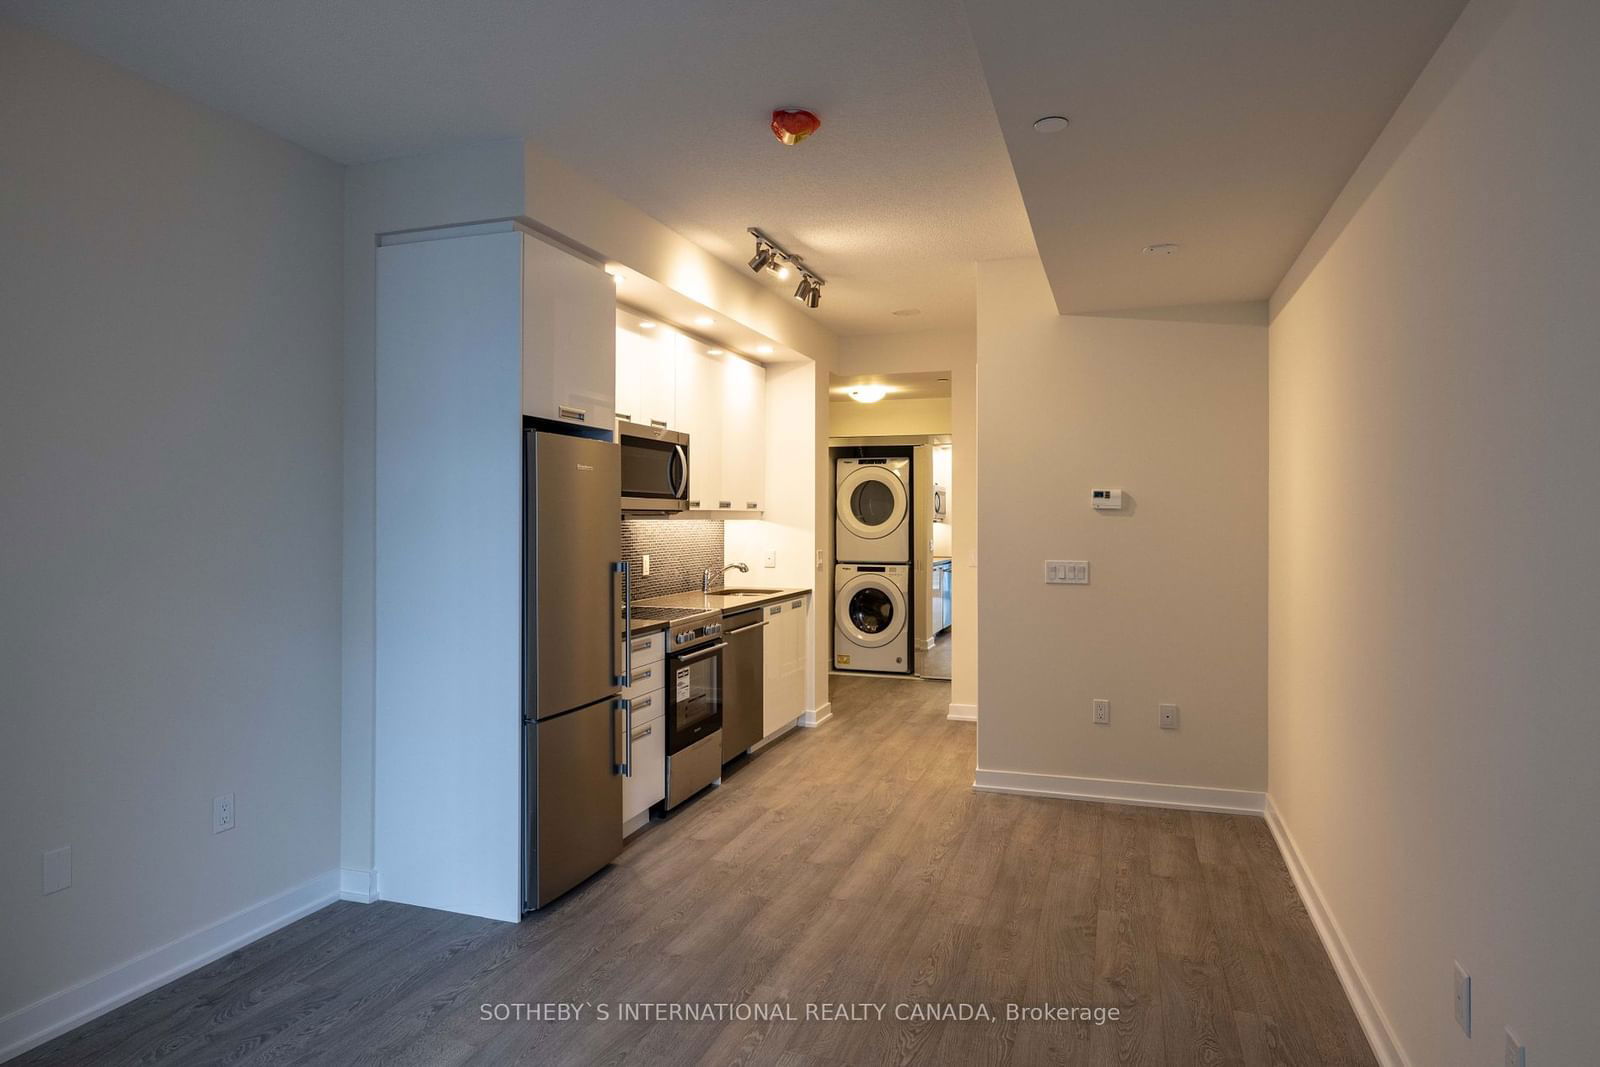
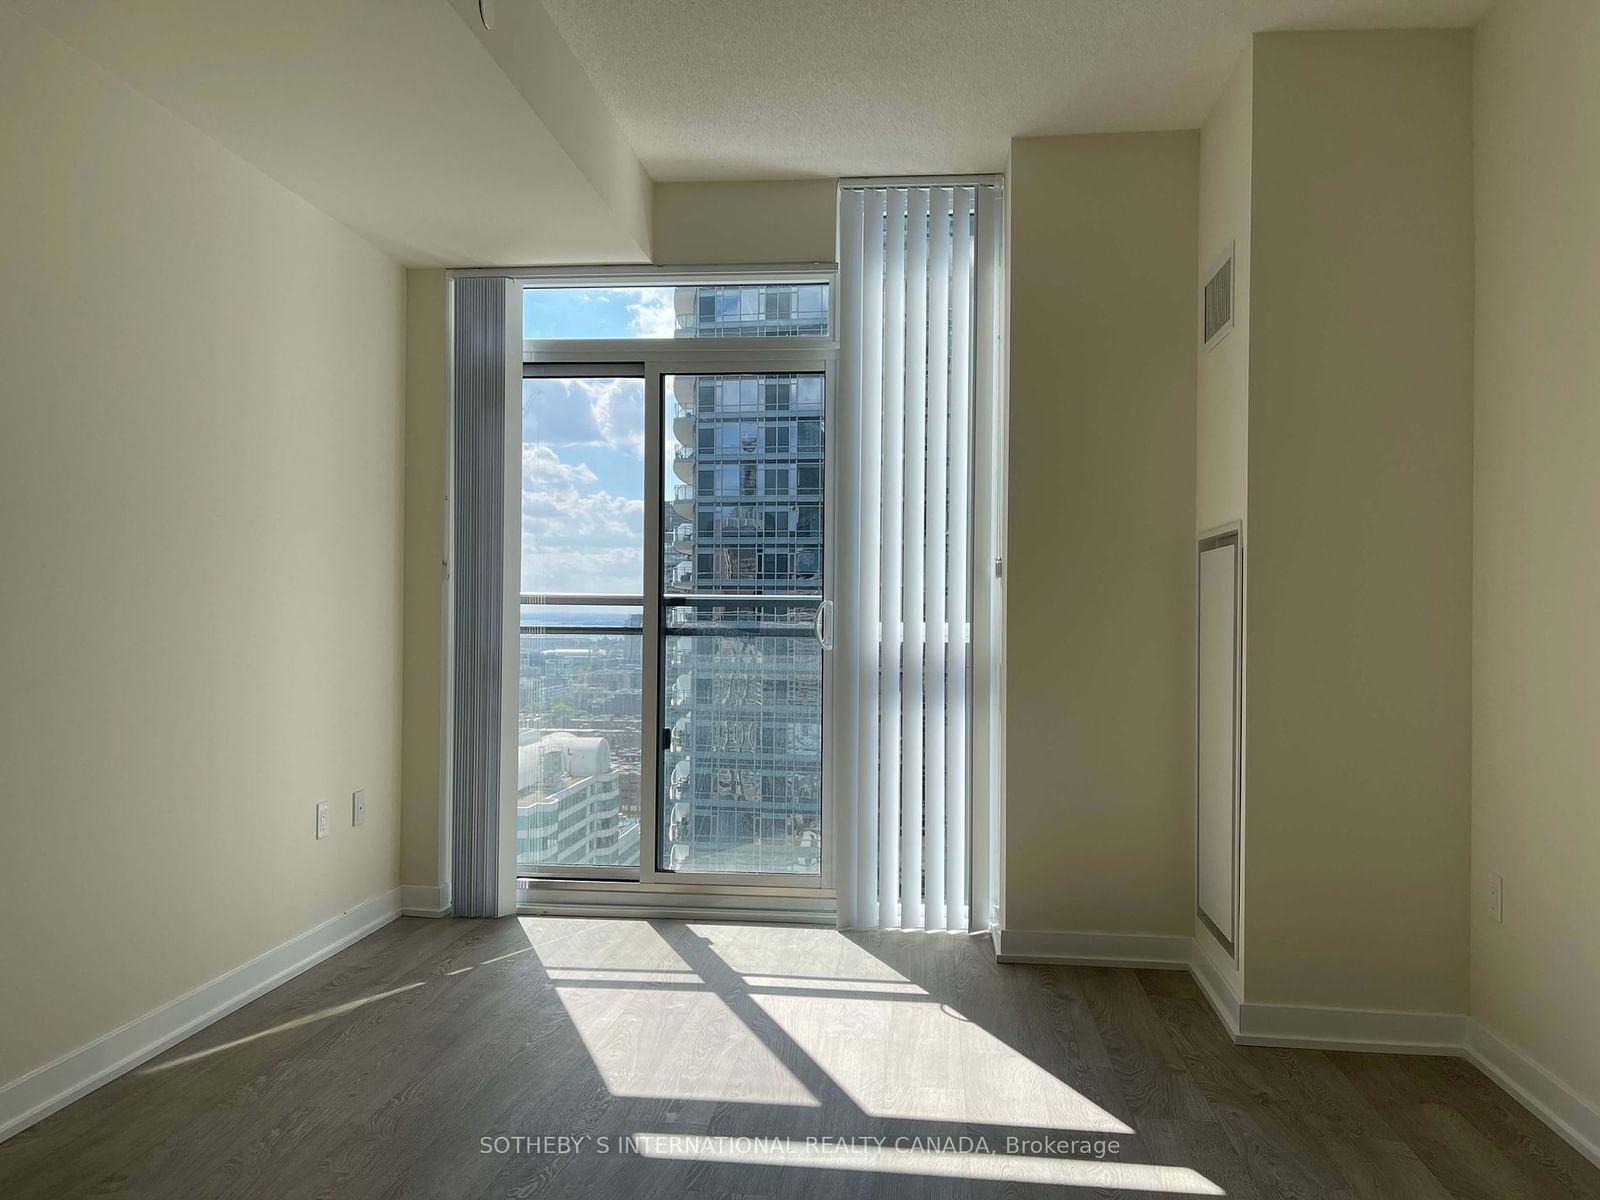
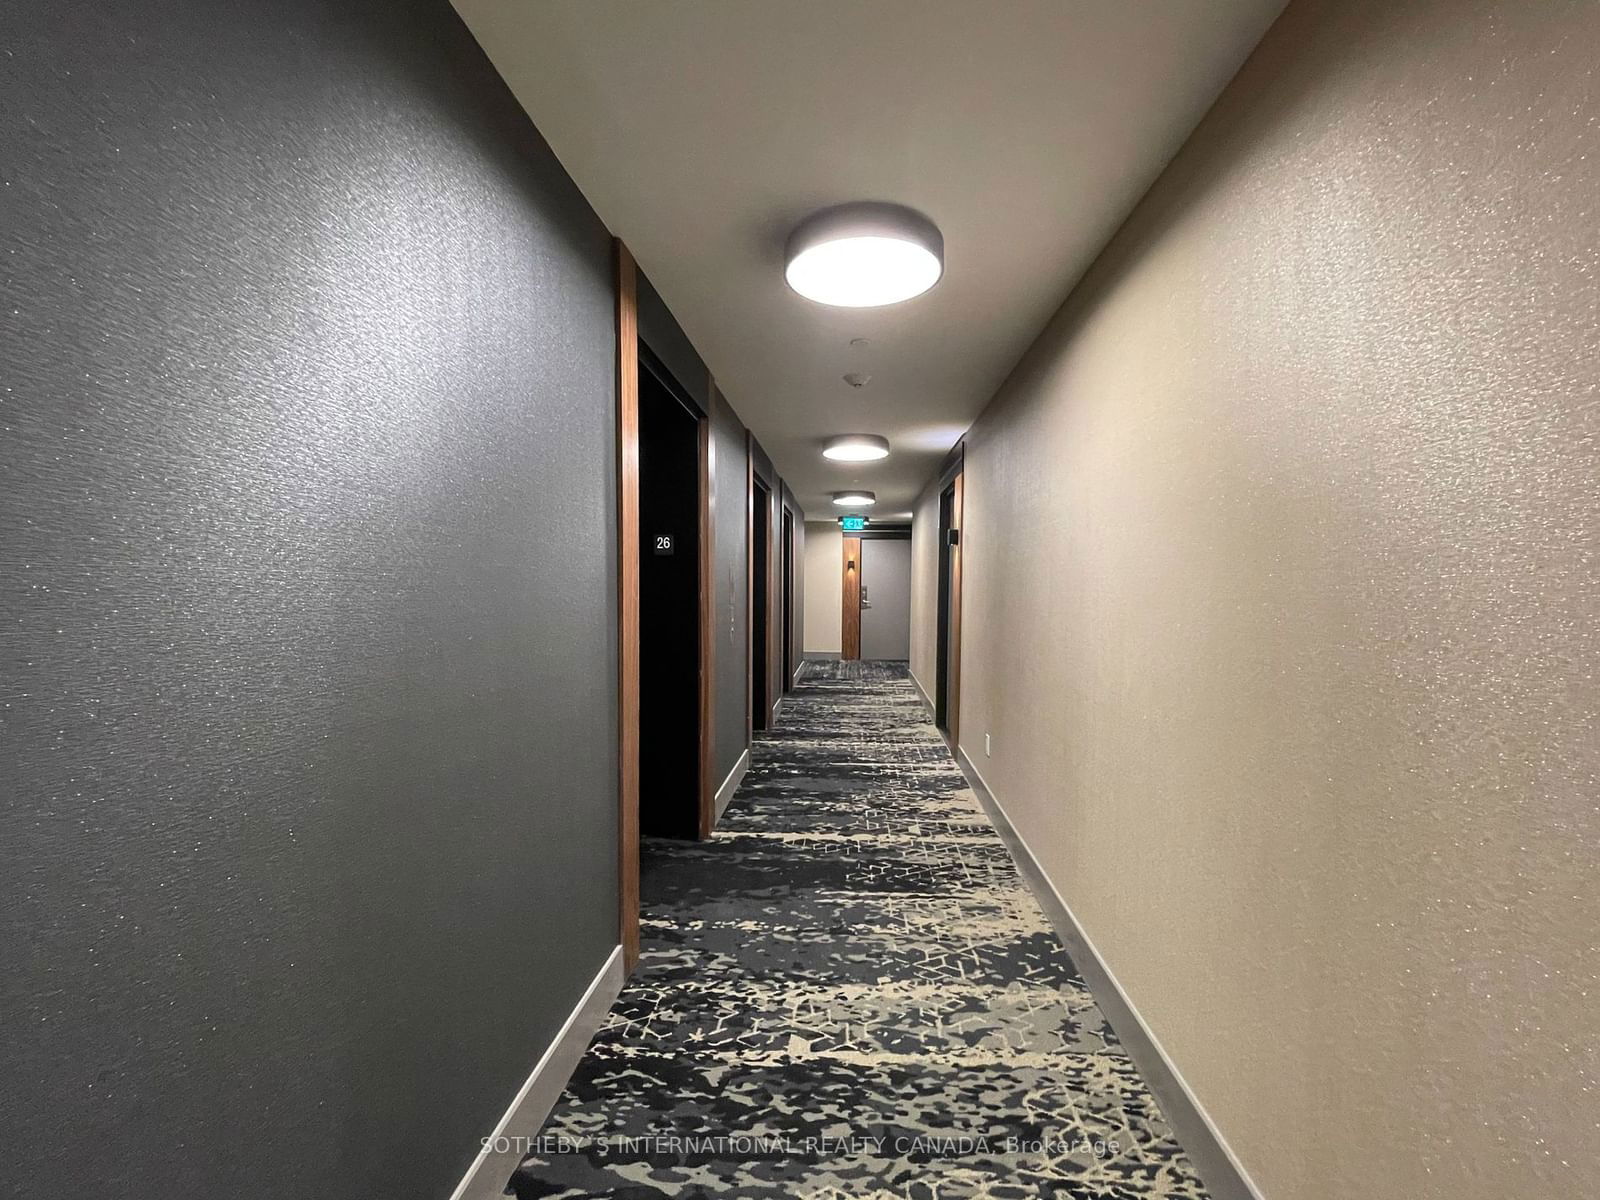
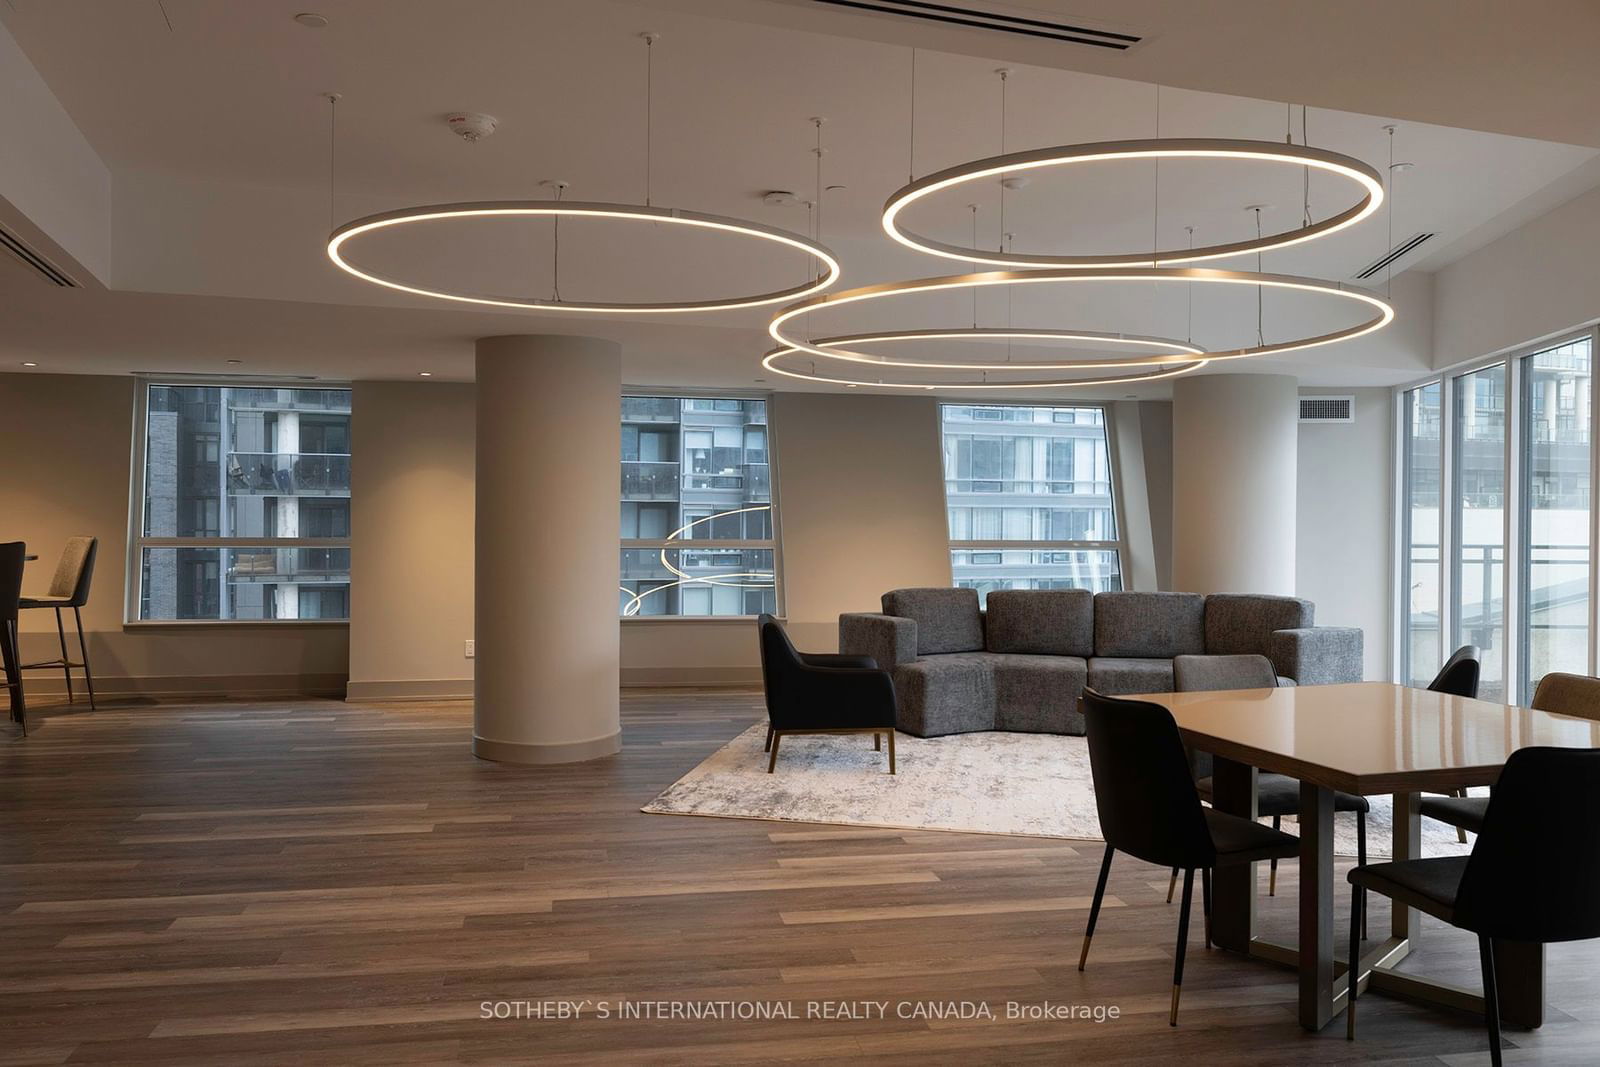
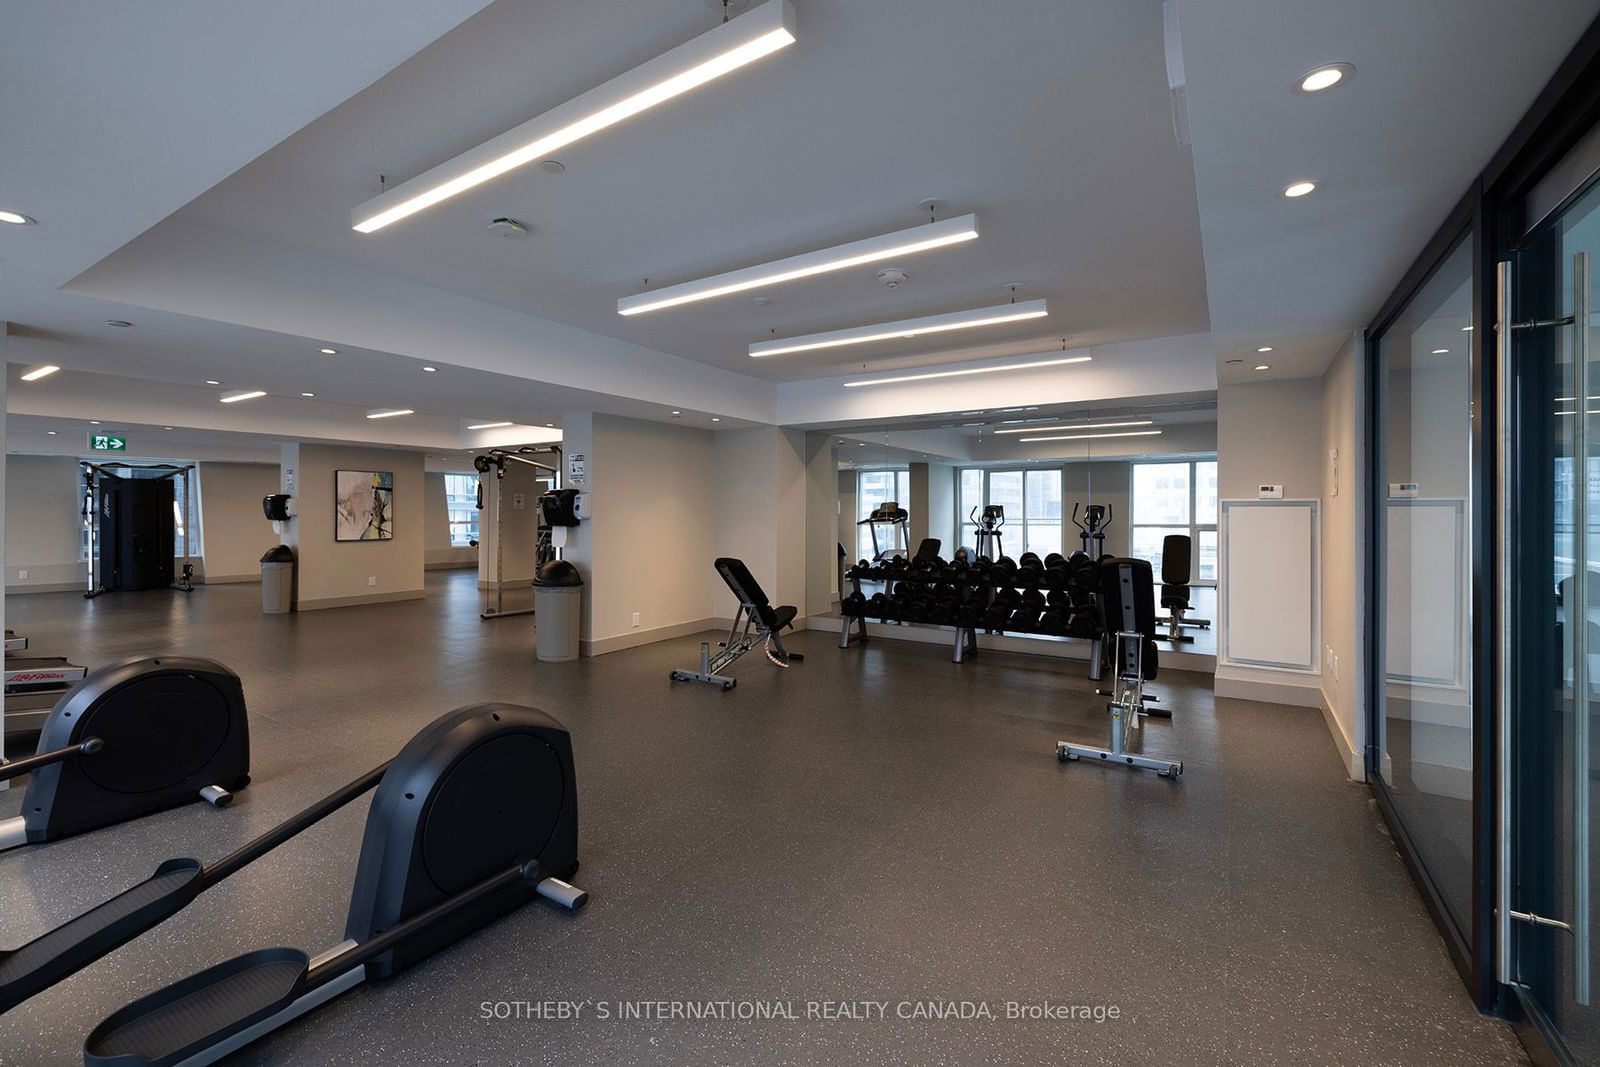
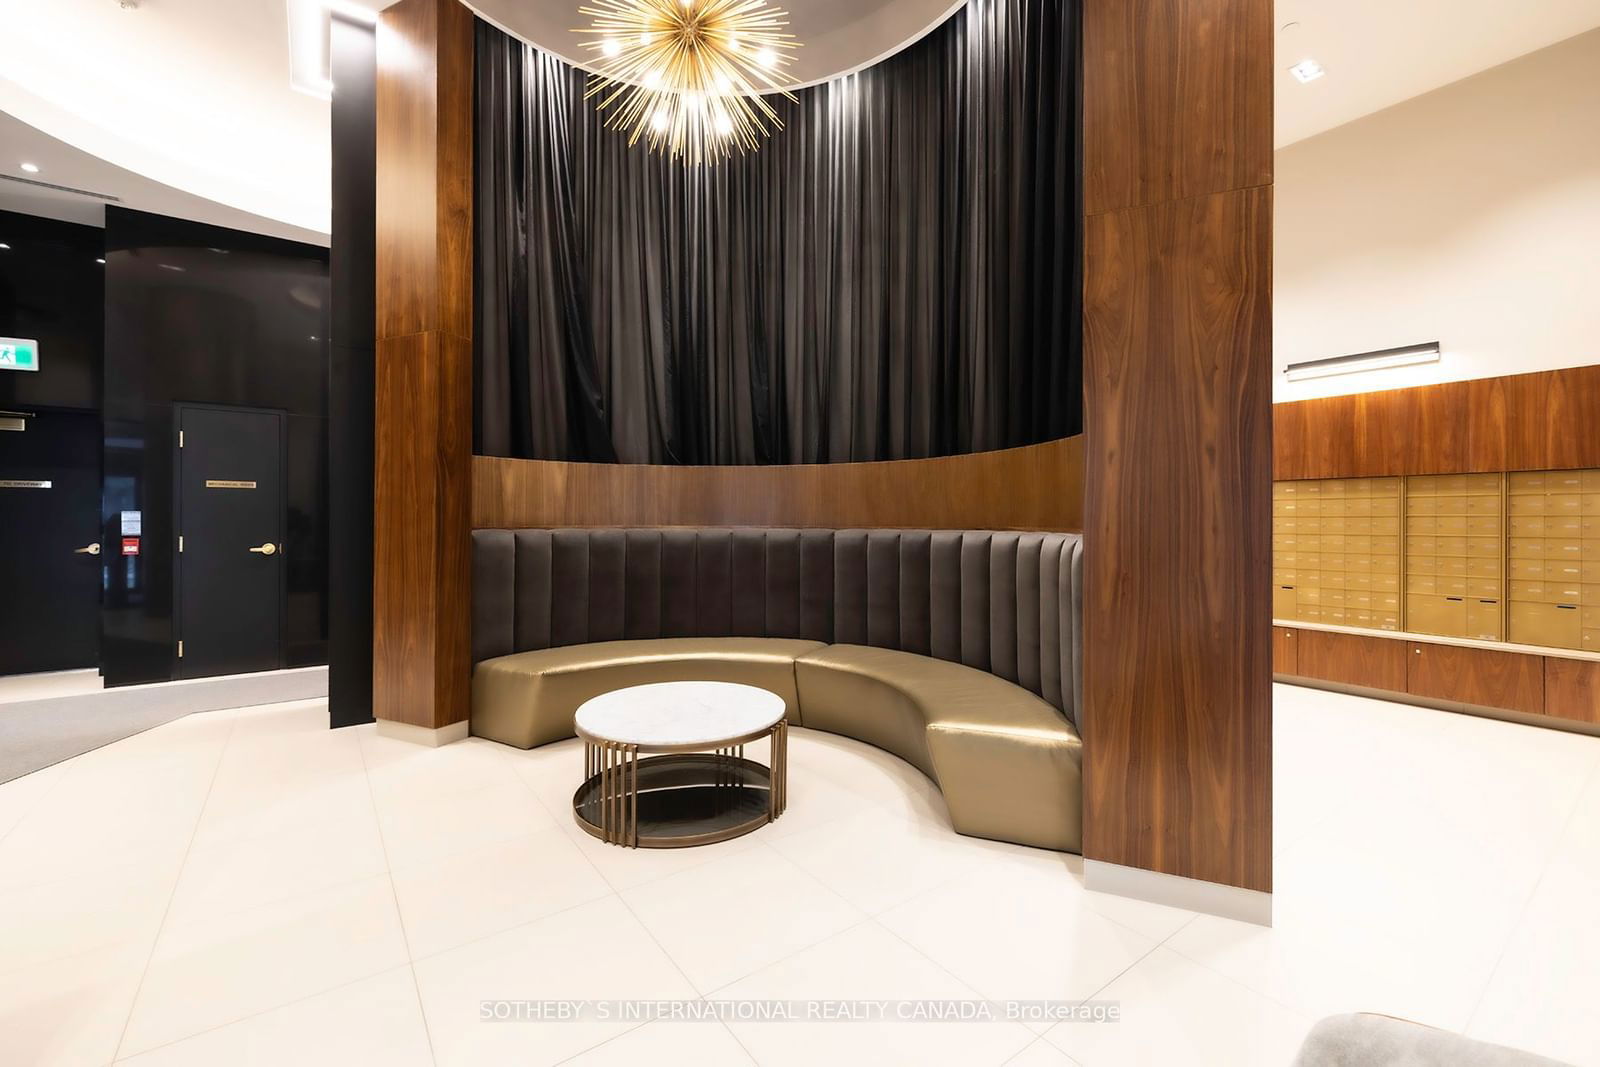
Beautiful PJ condo Located In The Heart Of Entertainment District. Close To Financial District. Steps To Cn Tower, Rogers Centre, Toronto's Best Restaurants & Shops. Luxurious Outdoor Swimming Pool, Hot Tub and Sun Decks, Outdoor Terrace with BBQ area, Multi-Purpose/Party Room with Kitchenette and Bar, Private Dining Room, Business Centre, Fully Equipped Fitness Centre, Serene Yoga Room, and 24 Hr Concierge.
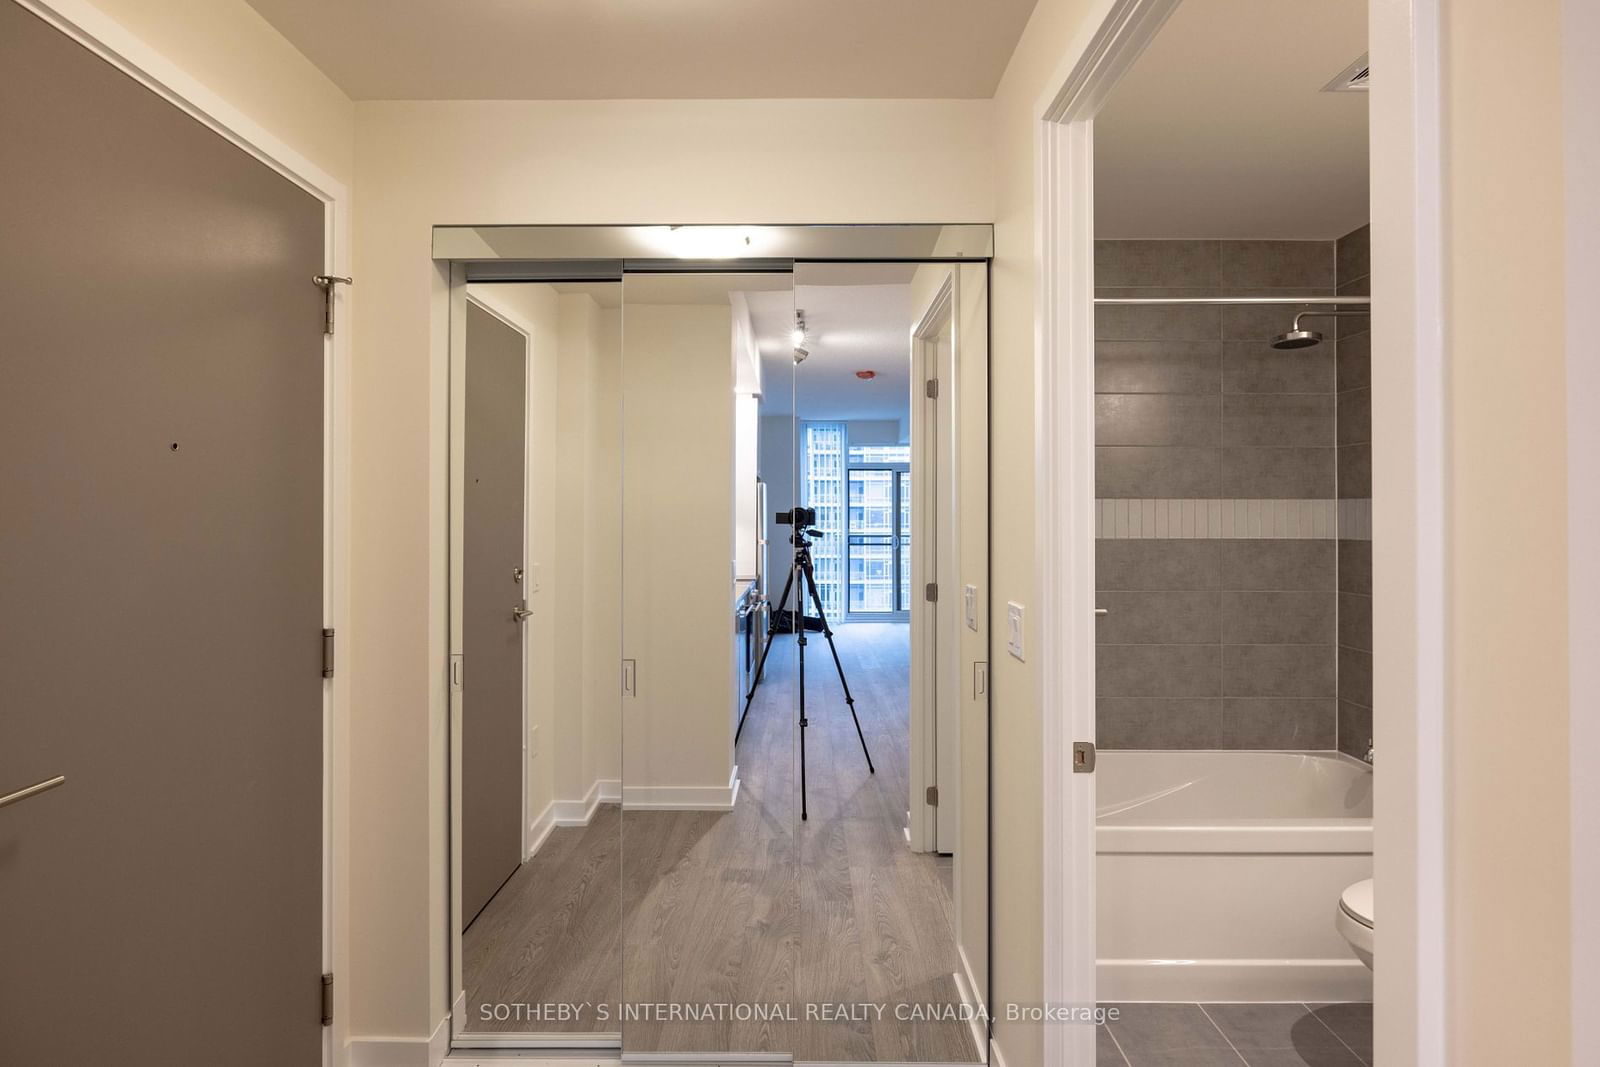
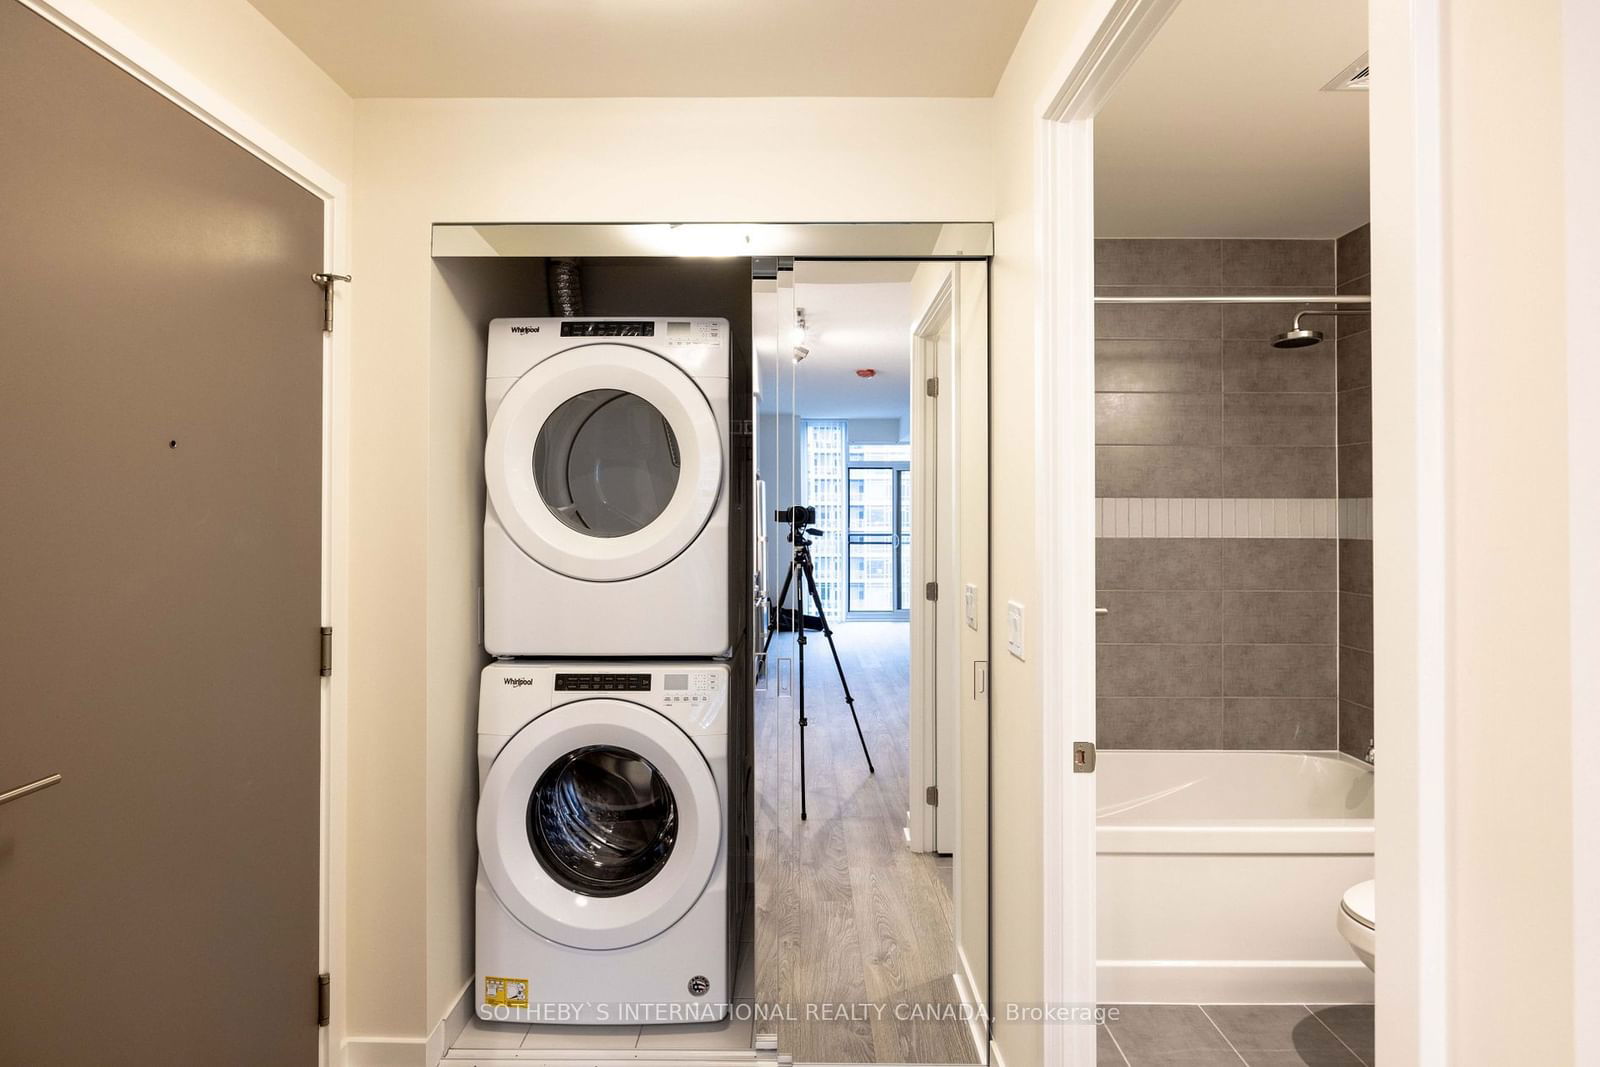
ExtrasLaminate Flr, Kitchen w/Quartz Countertop & S/S Stove, 24 S/S B/I Dishwasher, 24 S/S & S/I Range,24 S/S Refrigerator, Microwave with B/I High-Capacity Hood Fen. White F/size, w/D Stacking, Window Coving, Professional Cleaned & Painted.
sotheby`s international realty canadaMLS® #C9392978
Amenities
Explore Neighbourhood
Similar Listings
Demographics
Based on the dissemination area as defined by Statistics Canada. A dissemination area contains, on average, approximately 200 – 400 households.
Price Trends
Maintenance Fees
Building Trends At The PJ Condos
Days on Strata
List vs Selling Price
Offer Competition
Turnover of Units
Property Value
Price Ranking
Sold Units
Rented Units
Best Value Rank
Appreciation Rank
Rental Yield
High Demand
Transaction Insights at 283 Adelaide Street W
| Studio | 1 Bed | 1 Bed + Den | 2 Bed | 2 Bed + Den | 3 Bed | 3 Bed + Den | |
|---|---|---|---|---|---|---|---|
| Price Range | $572,500 | $608,000 - $625,000 | $700,000 - $775,000 | $748,000 - $1,050,000 | No Data | No Data | $2,200,000 |
| Avg. Cost Per Sqft | $961 | $1,157 | $1,236 | $1,096 | No Data | No Data | $1,470 |
| Price Range | $1,900 - $2,200 | $2,300 - $2,650 | $1,600 - $3,200 | $2,800 - $3,750 | $3,450 - $3,600 | $3,700 - $4,000 | $4,750 |
| Avg. Wait for Unit Availability | 2846 Days | 718 Days | 294 Days | 375 Days | 2442 Days | No Data | 1379 Days |
| Avg. Wait for Unit Availability | 35 Days | 30 Days | 13 Days | 20 Days | 119 Days | 236 Days | 389 Days |
| Ratio of Units in Building | 11% | 15% | 40% | 22% | 5% | 3% | 6% |
Transactions vs Inventory
Total number of units listed and leased in King West
