Maintenance Fees
The Victoria vs The Downtown London Area


Condo
$1,271/mth
$3,461 (2024)
$213 - $243/sqft
Balcony
Exclusive
South
Immediately
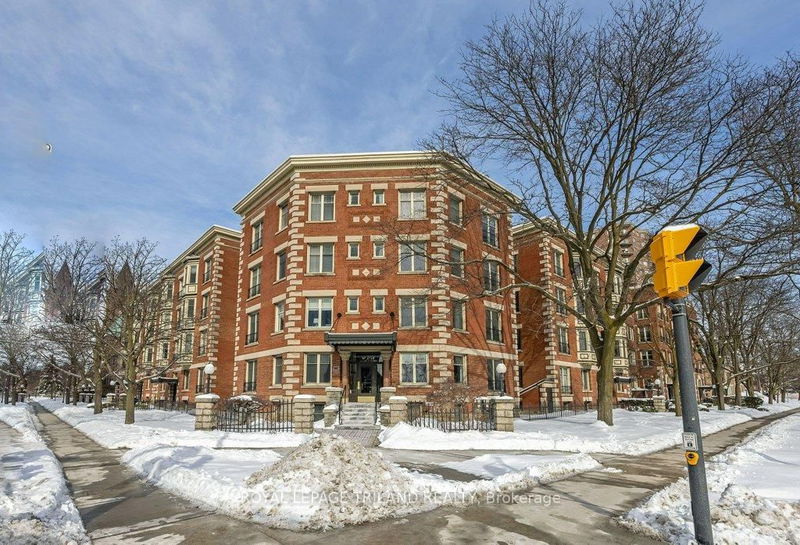
Located in the heart of downtown, this historic condominium stands as a testament to timeless character and charm. Whether you're drawn to the building's stately exterior or the warmth of its interior, this condo is a mix of the past meeting the present. This two- bedroom, two-full bathroom unit has an open living and dining room space with more than enough room for guests and an incredible amount of natural light. The original tiled fireplace and stained glass window are reminders of the charm this building still holds. The bright and updated kitchen with a quaint Juliette balcony are the perfect complement to this well-cared for home. In-suite laundry keeps things convenient as does the Murphy Bed in the 2nd bedroom if you desire a space for working out instead of sleeping. Seamlessly blending in with the architecture throughout the building are modern amenities such as a pool and gym across the courtyard. A storage unit and an underground parking spot are a bonus. Steps away from Victoria Park, The Delta Armouries or Joe Kools, this condo is not just a home; it is a piece of history, offering a distinctive living experience that balances tradition with the pulse of contemporary urban life.
ExtrasFridge, stove, dishwasher, microwave, stackable washer and dryer, brass wine glass holder in dining room, vintage chandelier in dining room, murphy bed
royal lepage triland realtyMLS® #X11977623
| Studio | 1 Bed | 2 Bed | 2 Bed + Den | |
|---|---|---|---|---|
| Price Range | No Data | No Data | $315,000 | $255,000 |
| Avg. Cost Per Sqft | No Data | No Data | $254 | $242 |
| Price Range | No Data | No Data | No Data | No Data |
| Avg. Wait for Unit Availability | No Data | 695 Days | 198 Days | No Data |
| Avg. Wait for Unit Availability | No Data | No Data | 352 Days | No Data |
| Ratio of Units in Building | 3% | 9% | 87% | 3% |
Total number of units listed and sold in Downtown London
