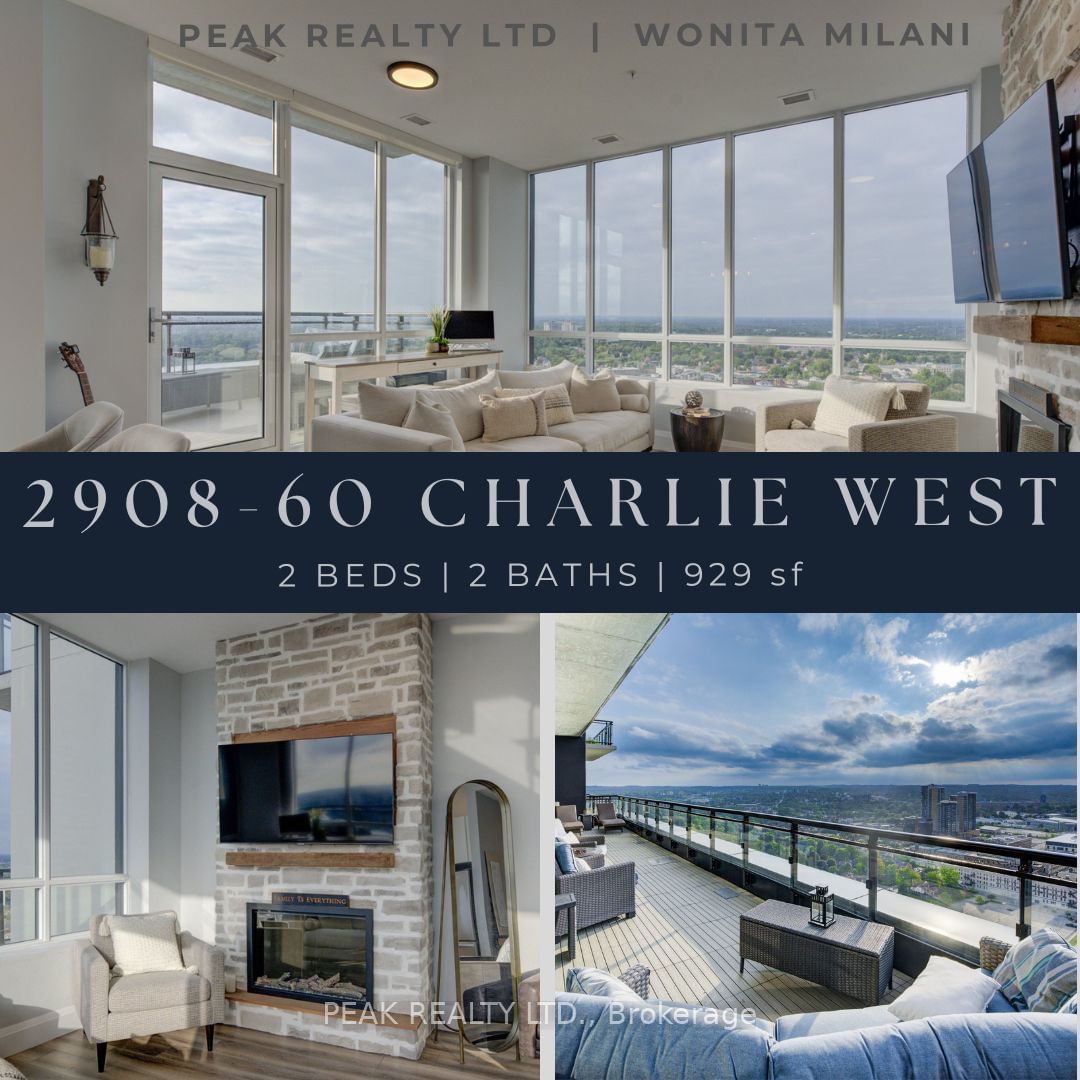
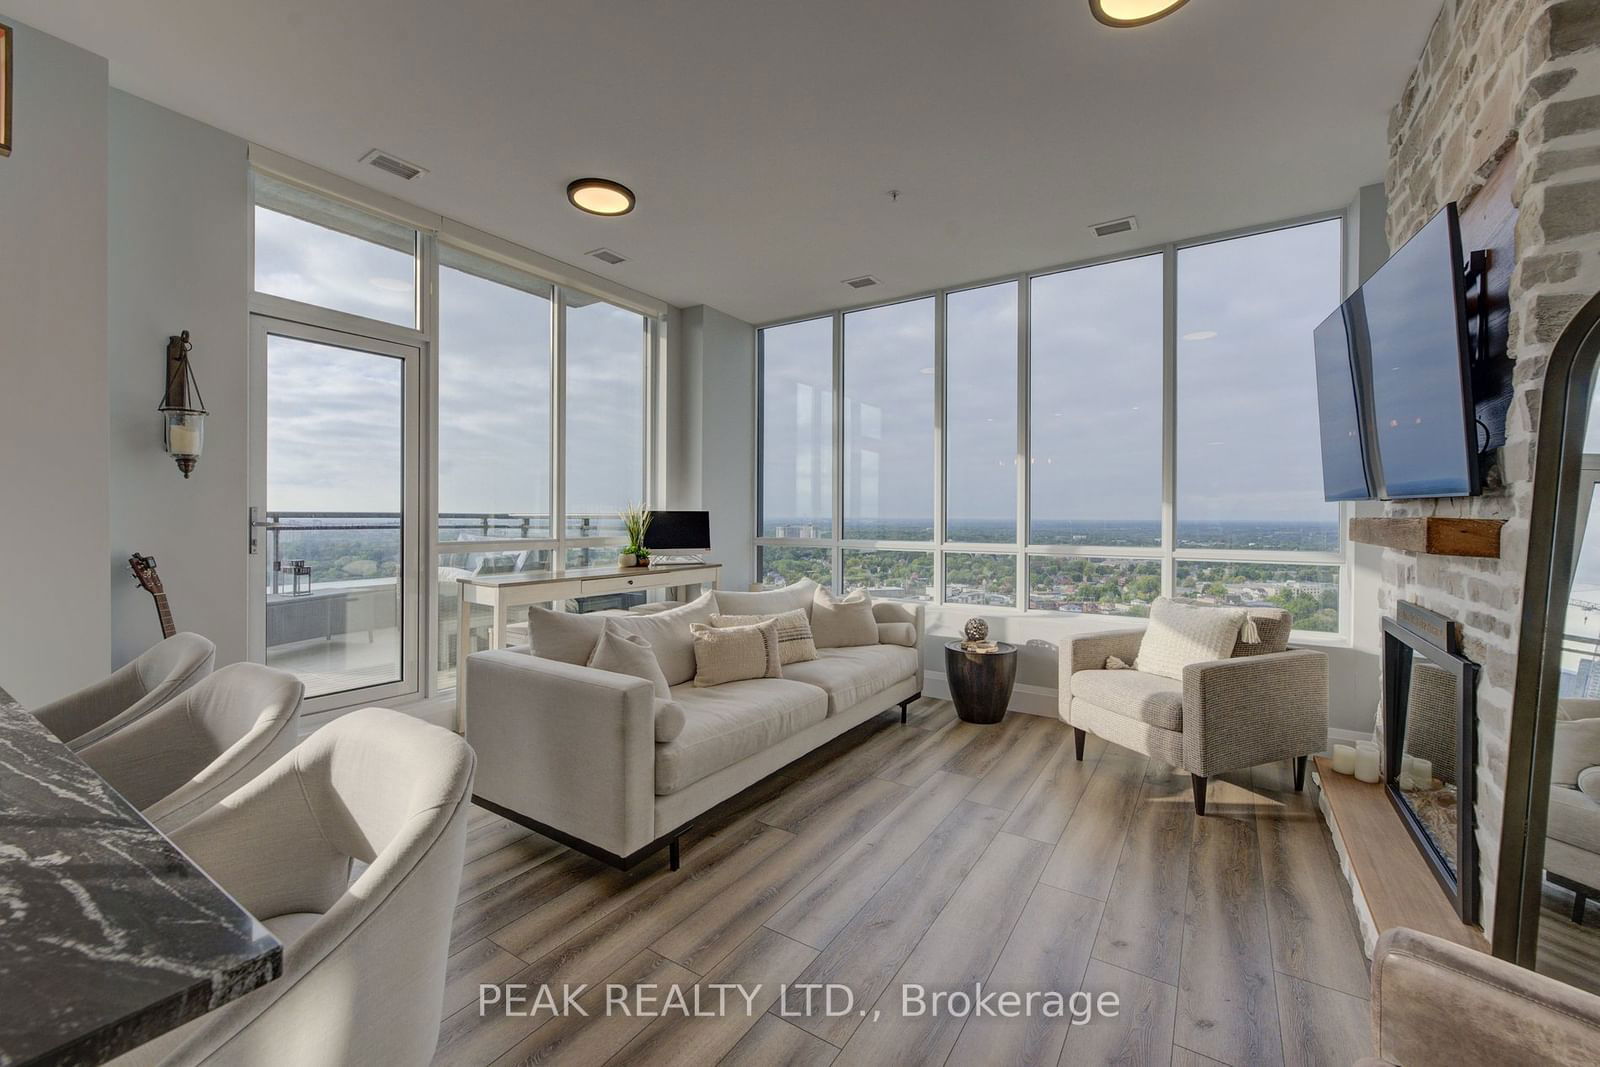
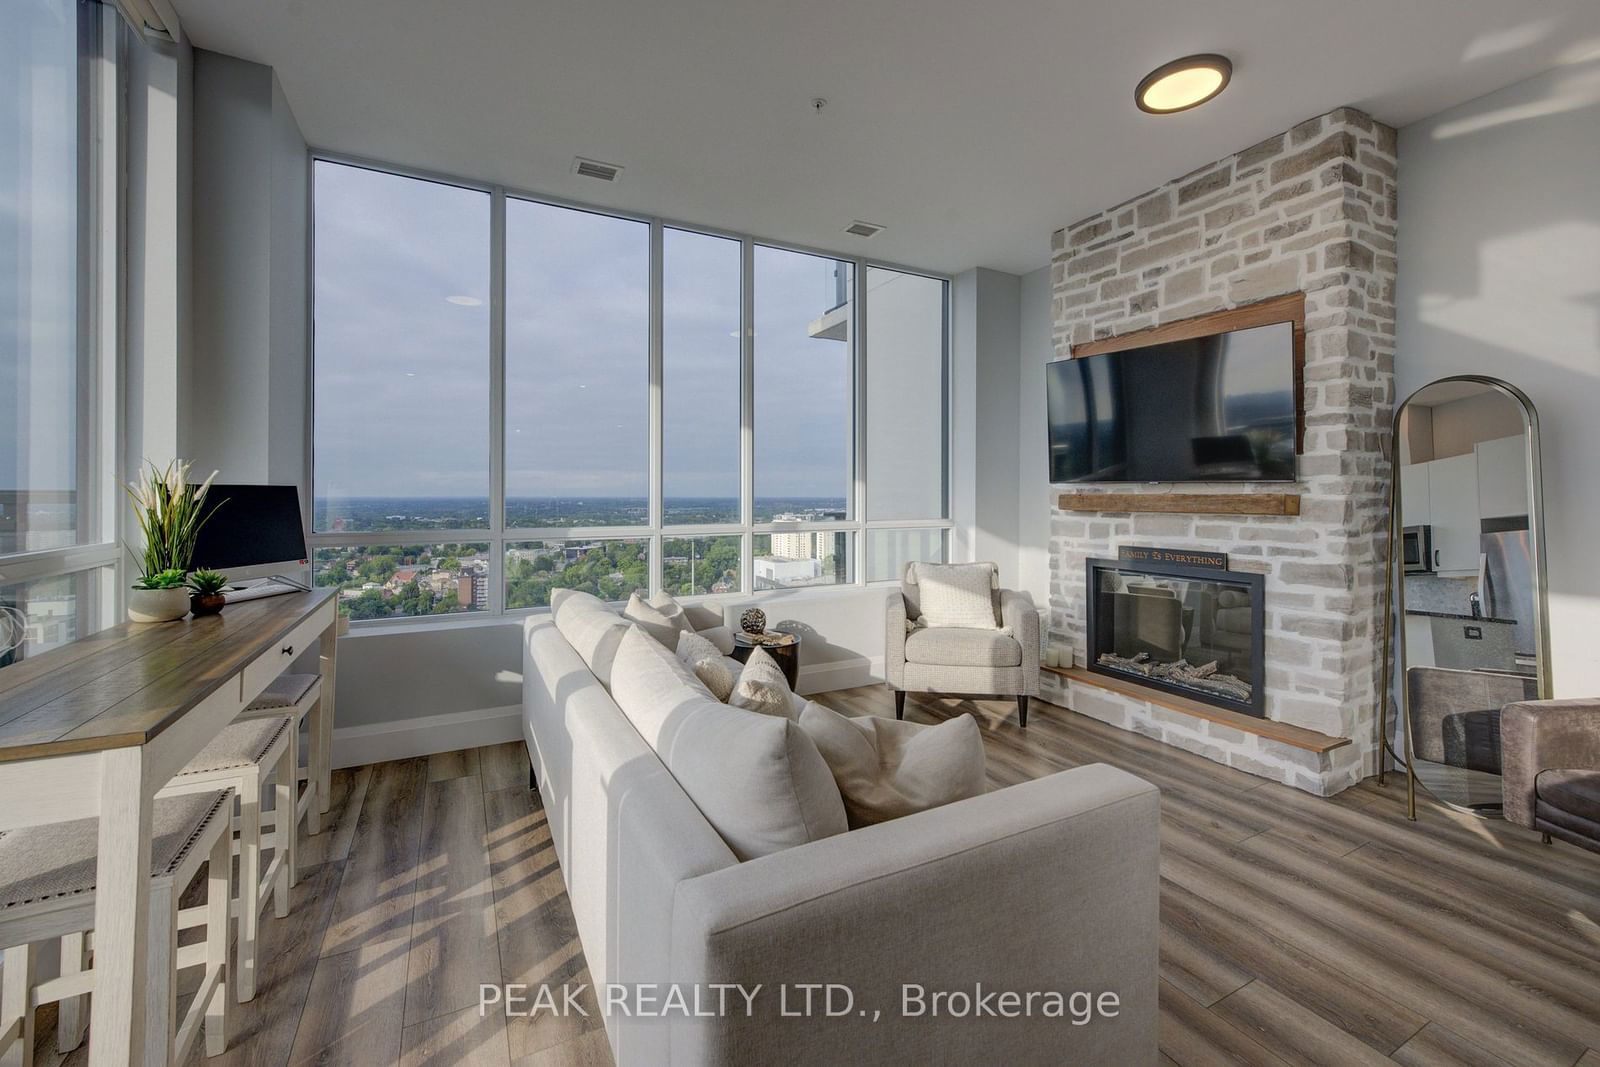
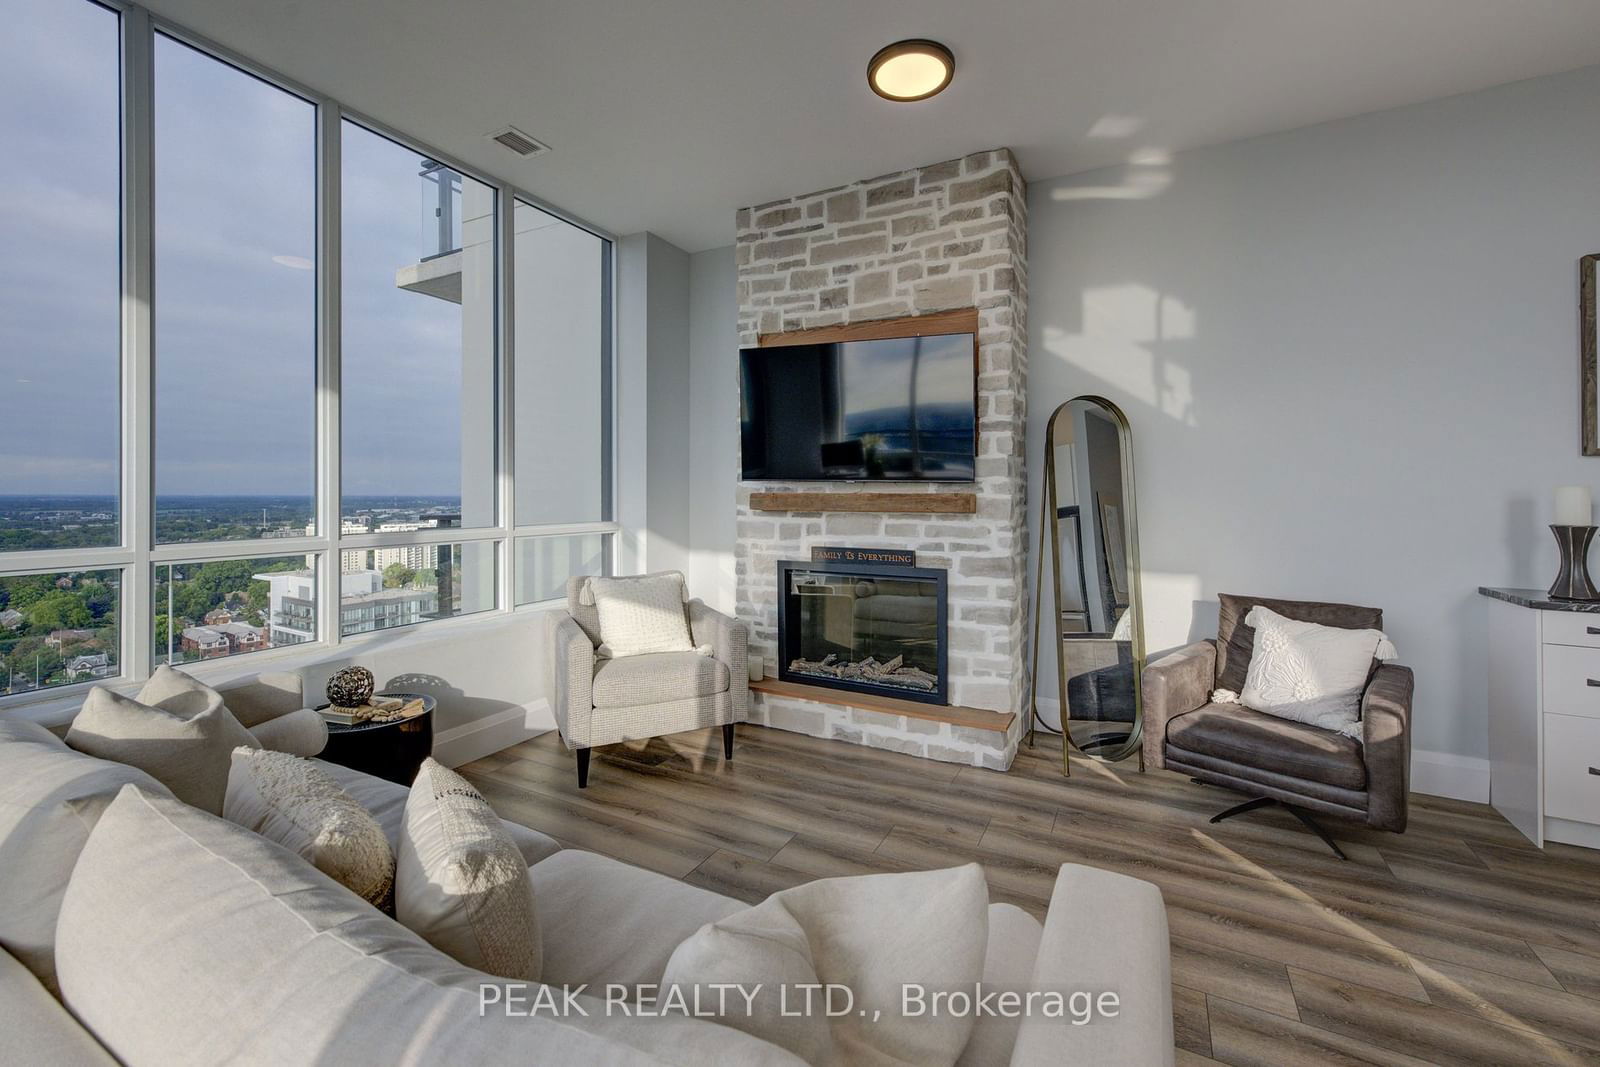
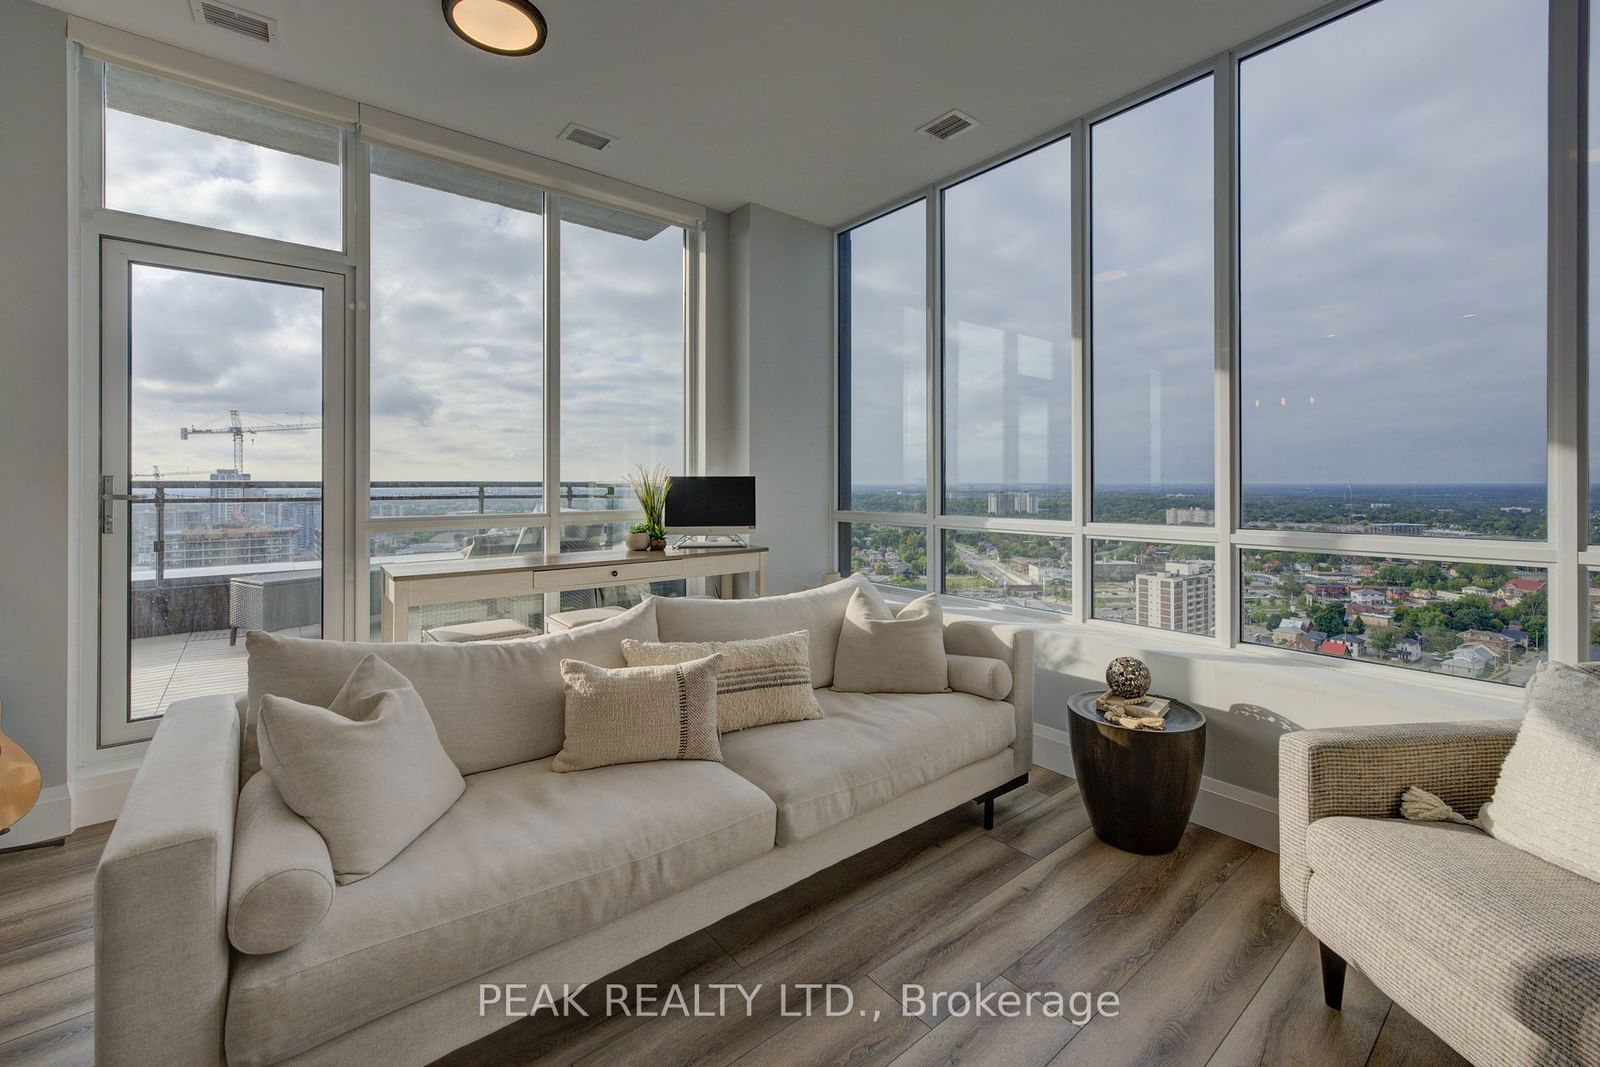
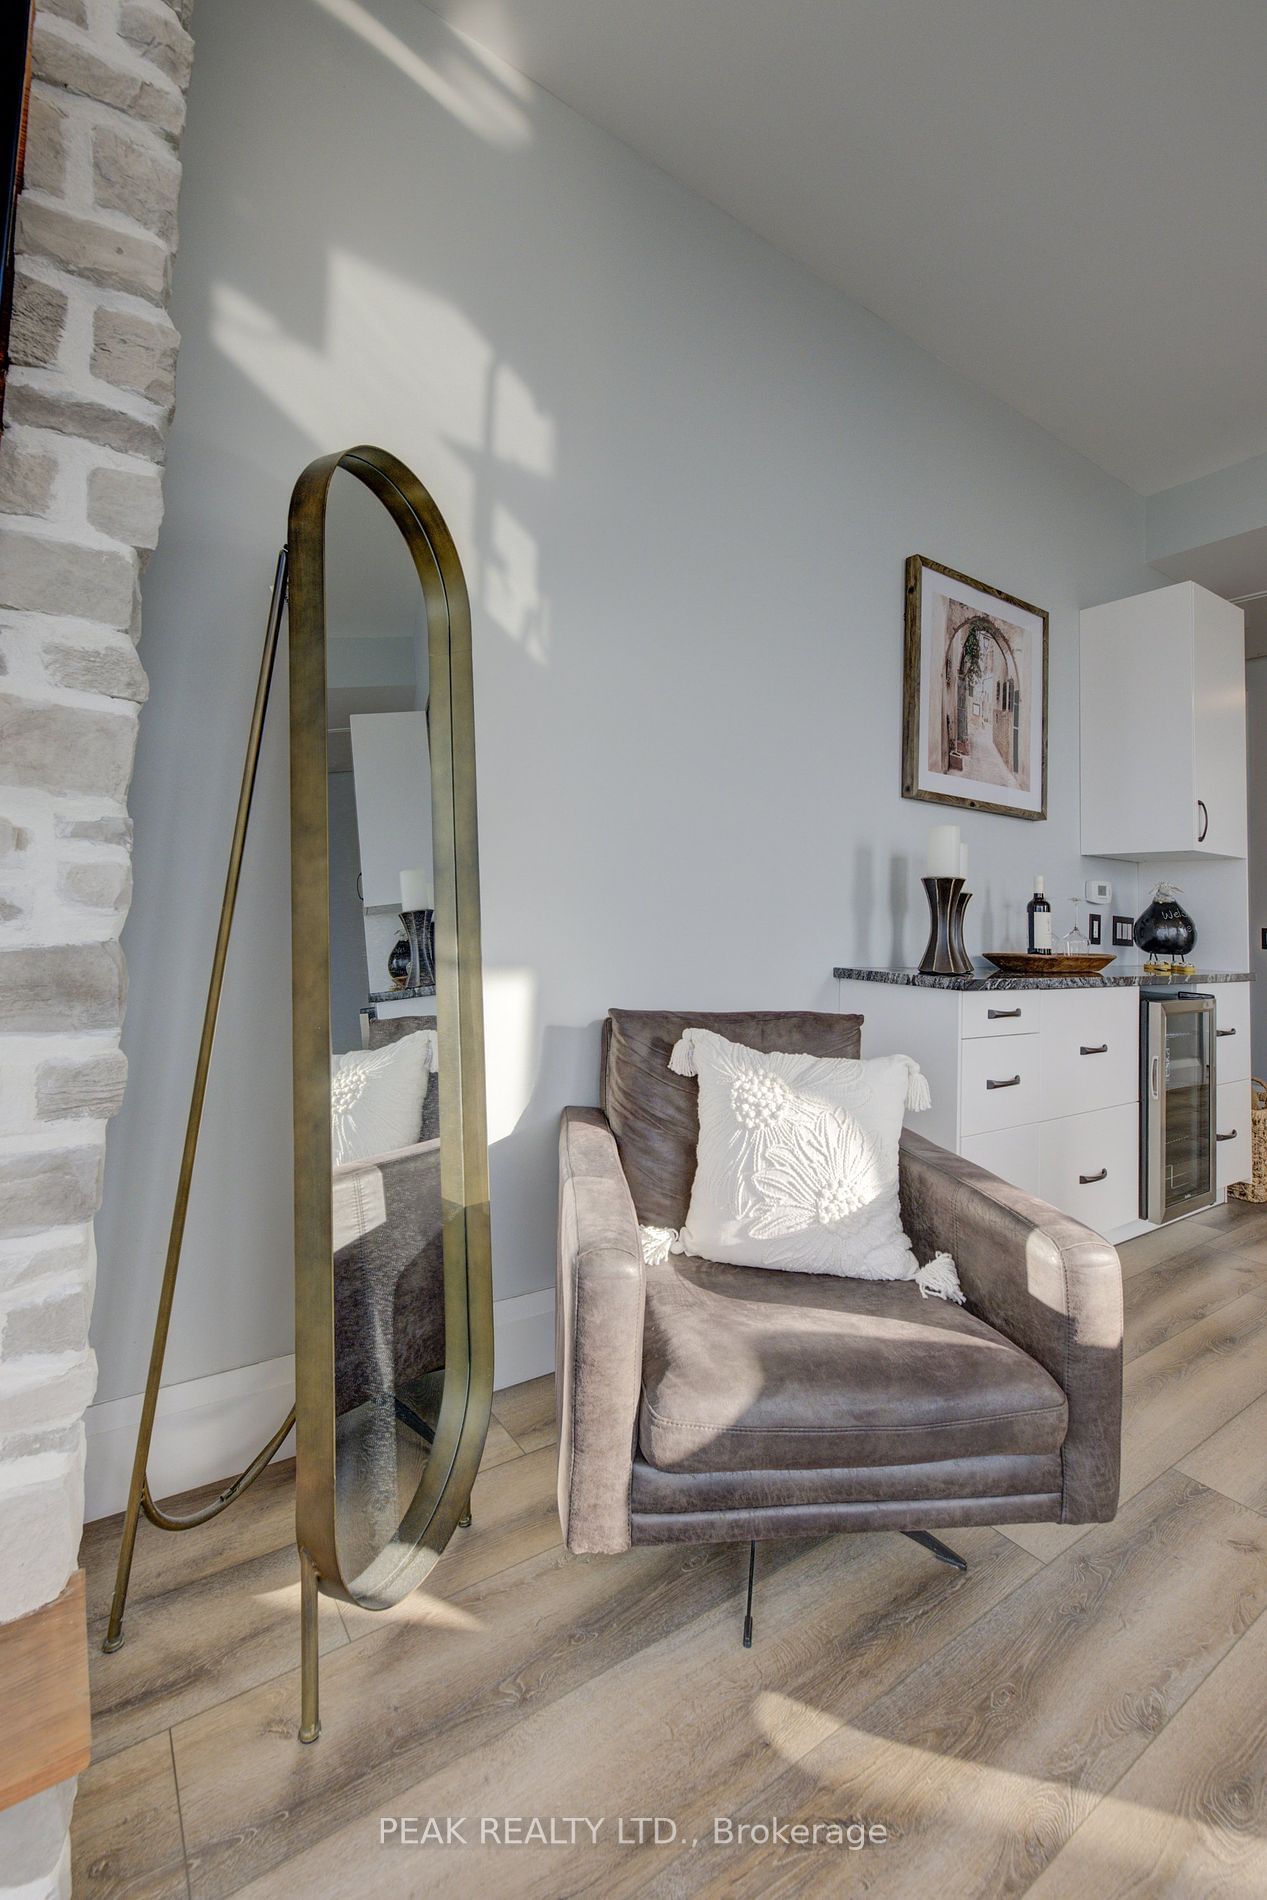
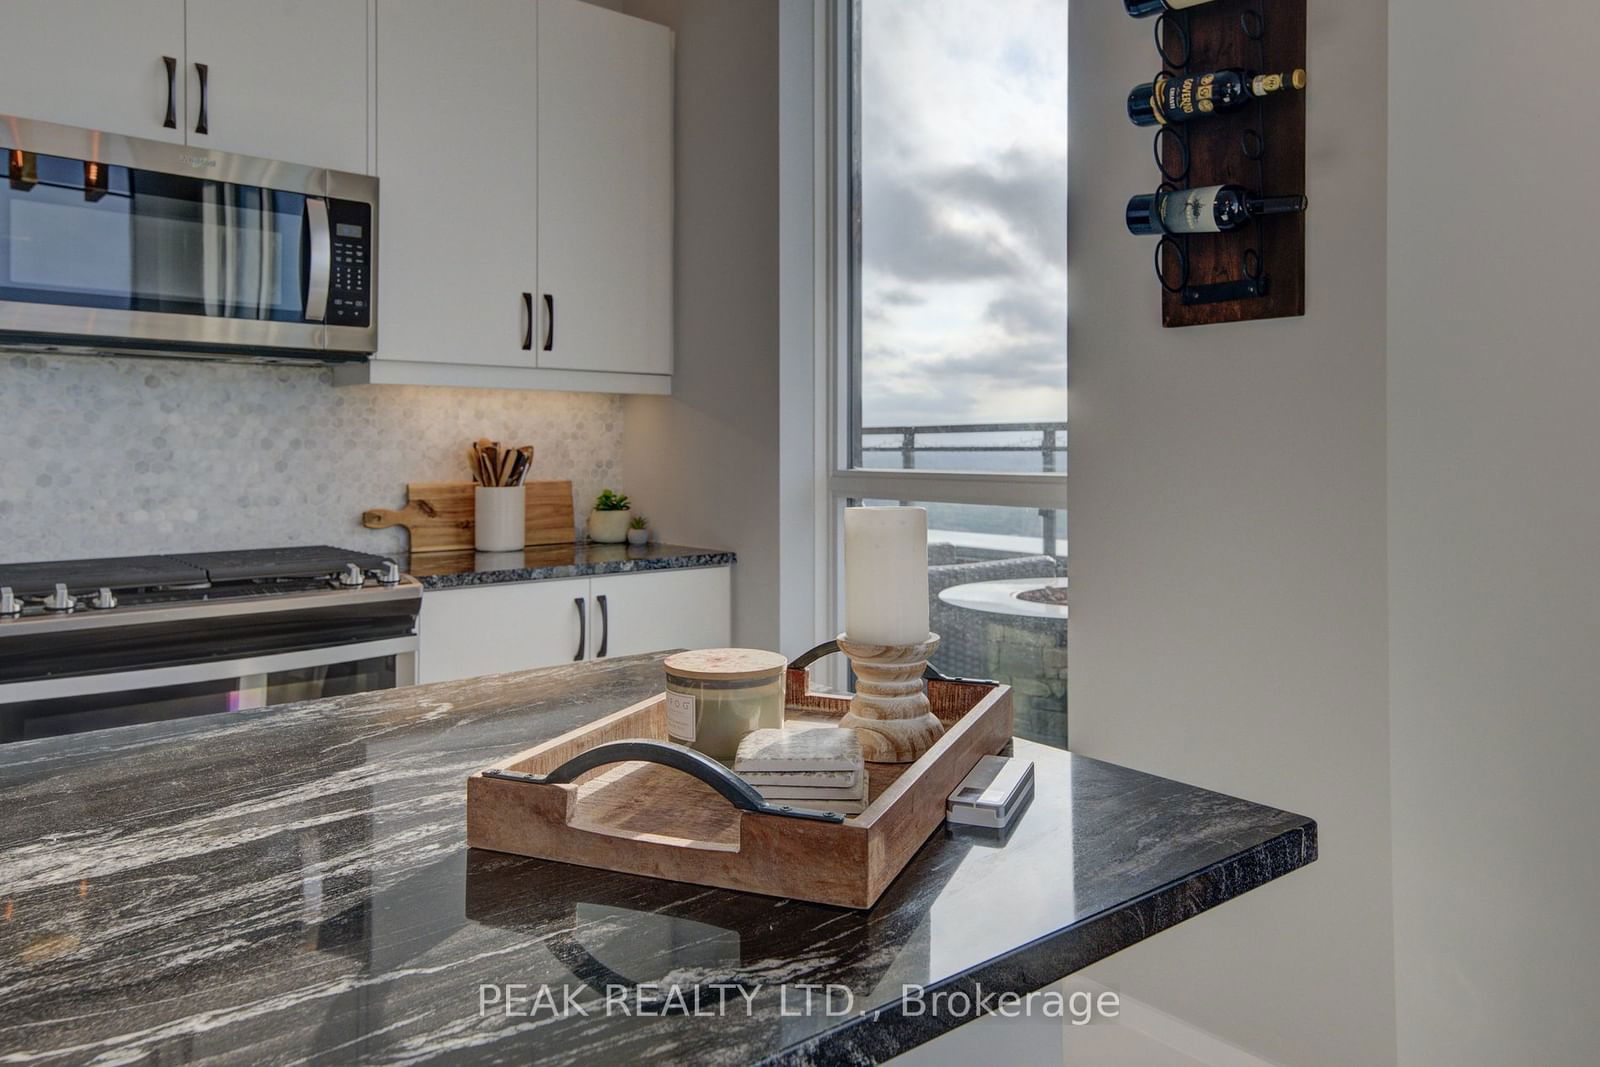
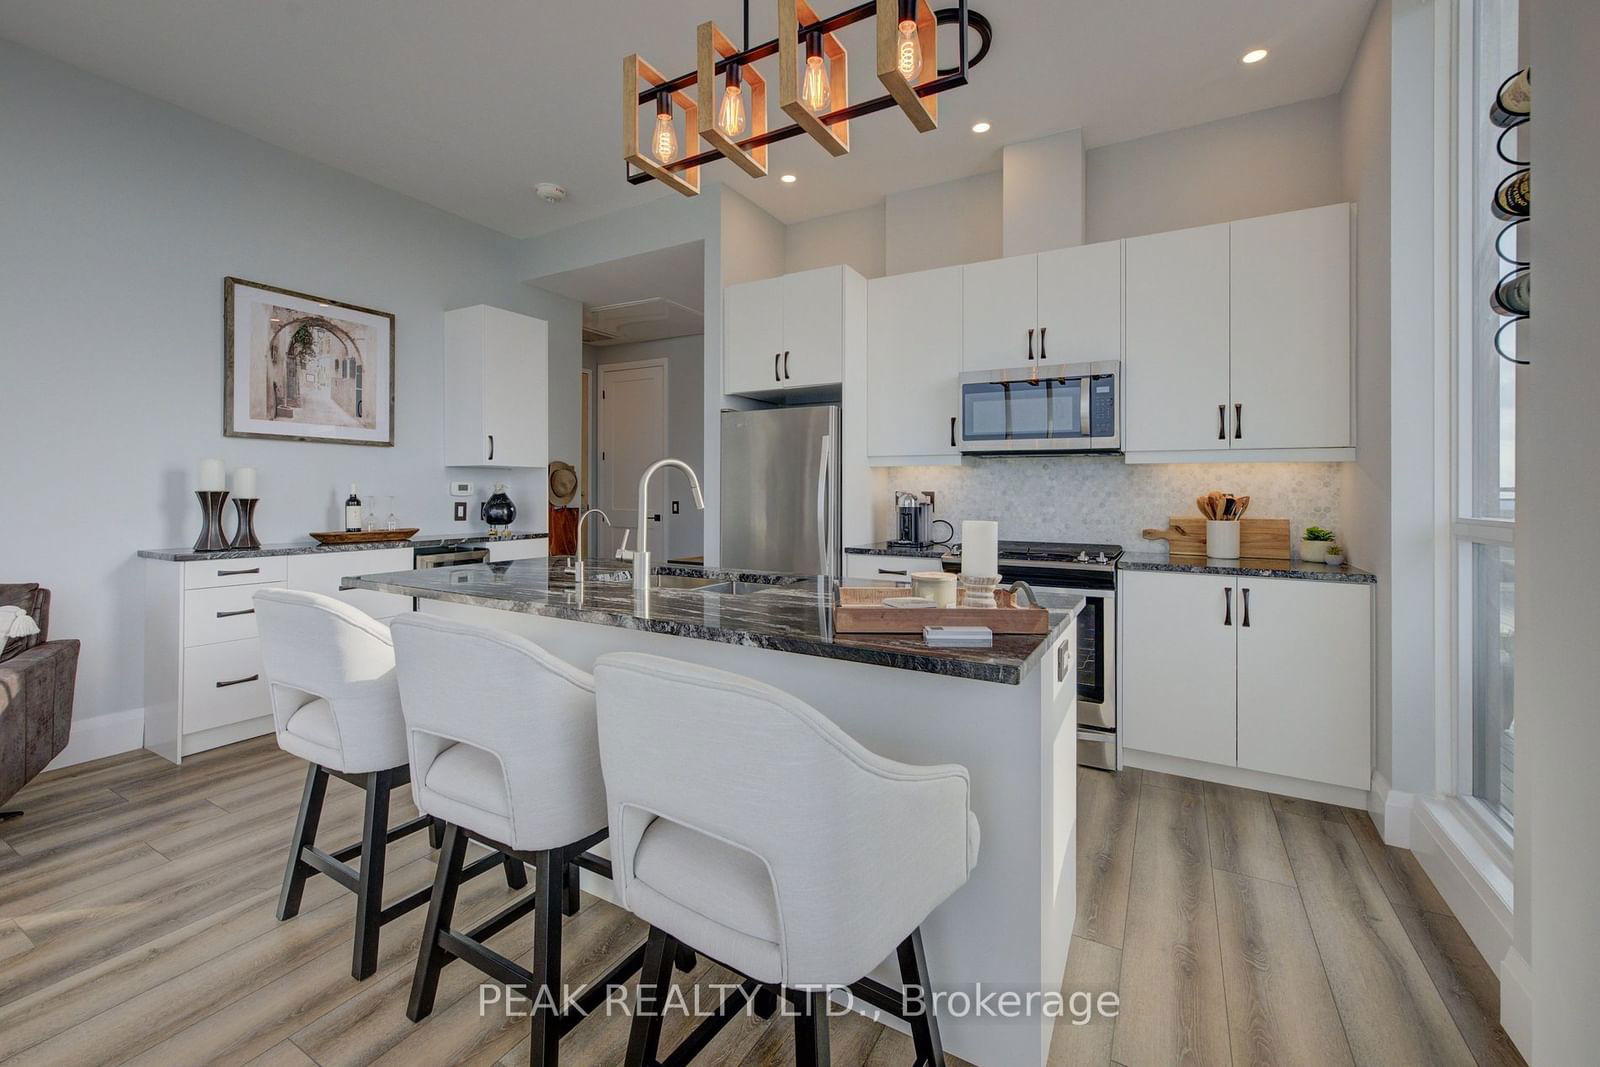
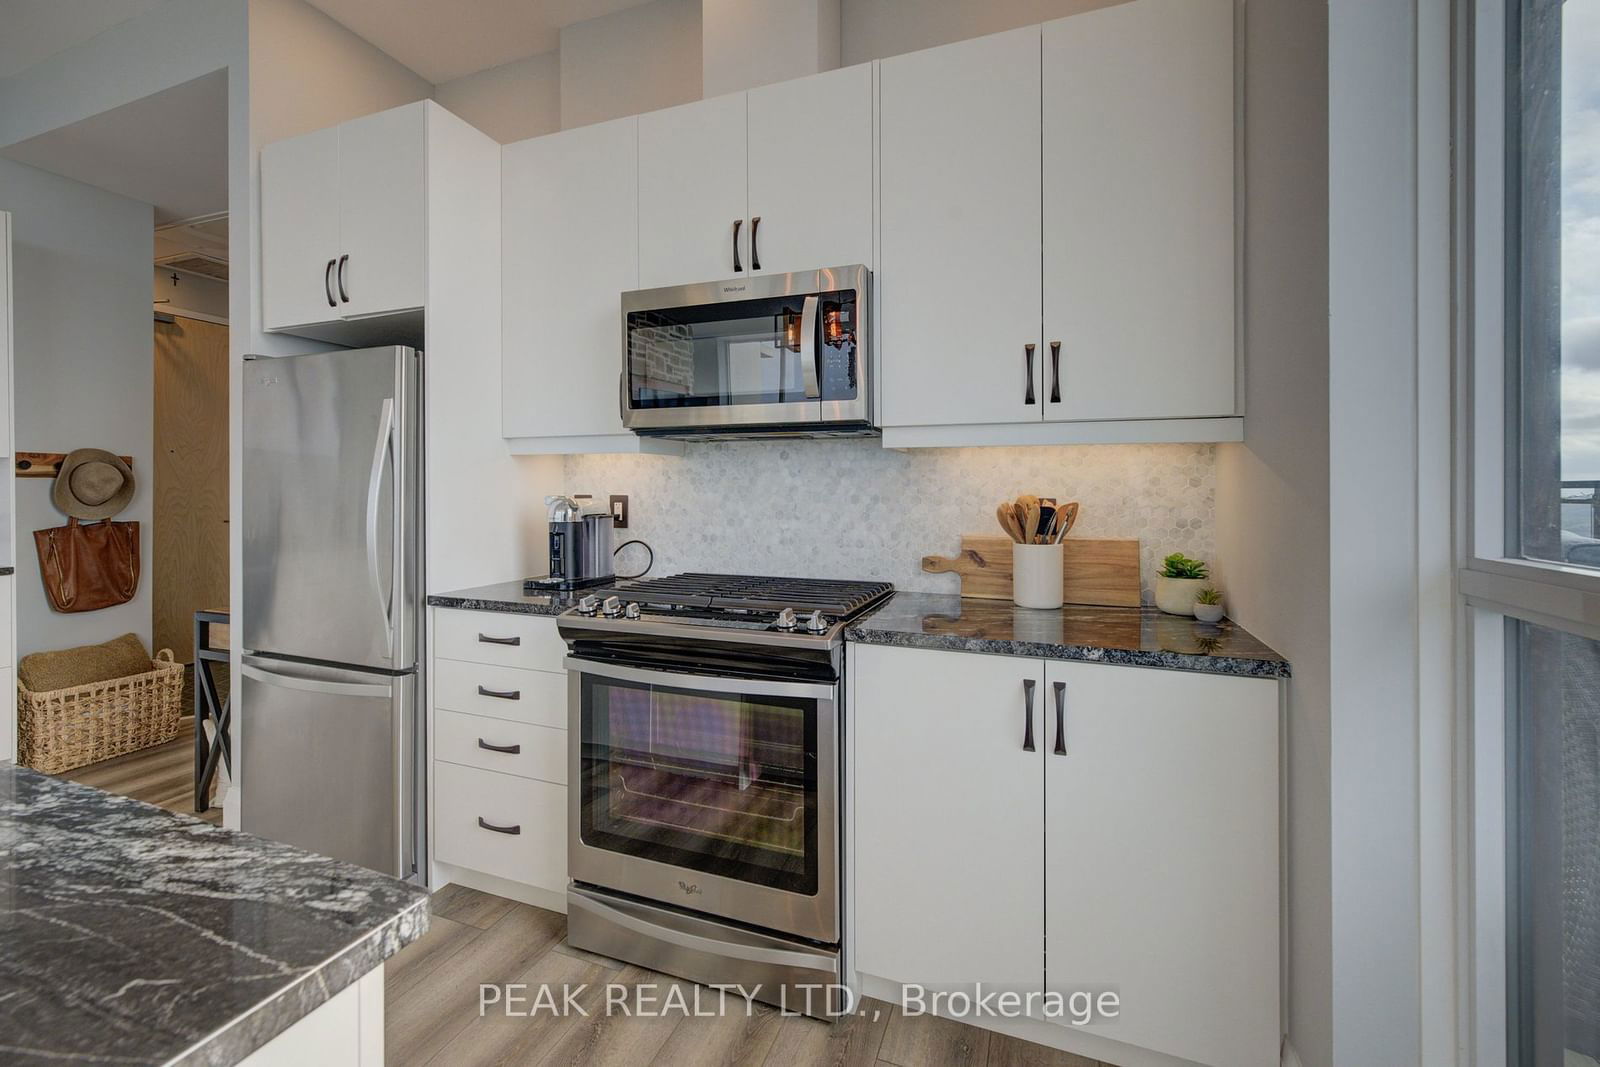
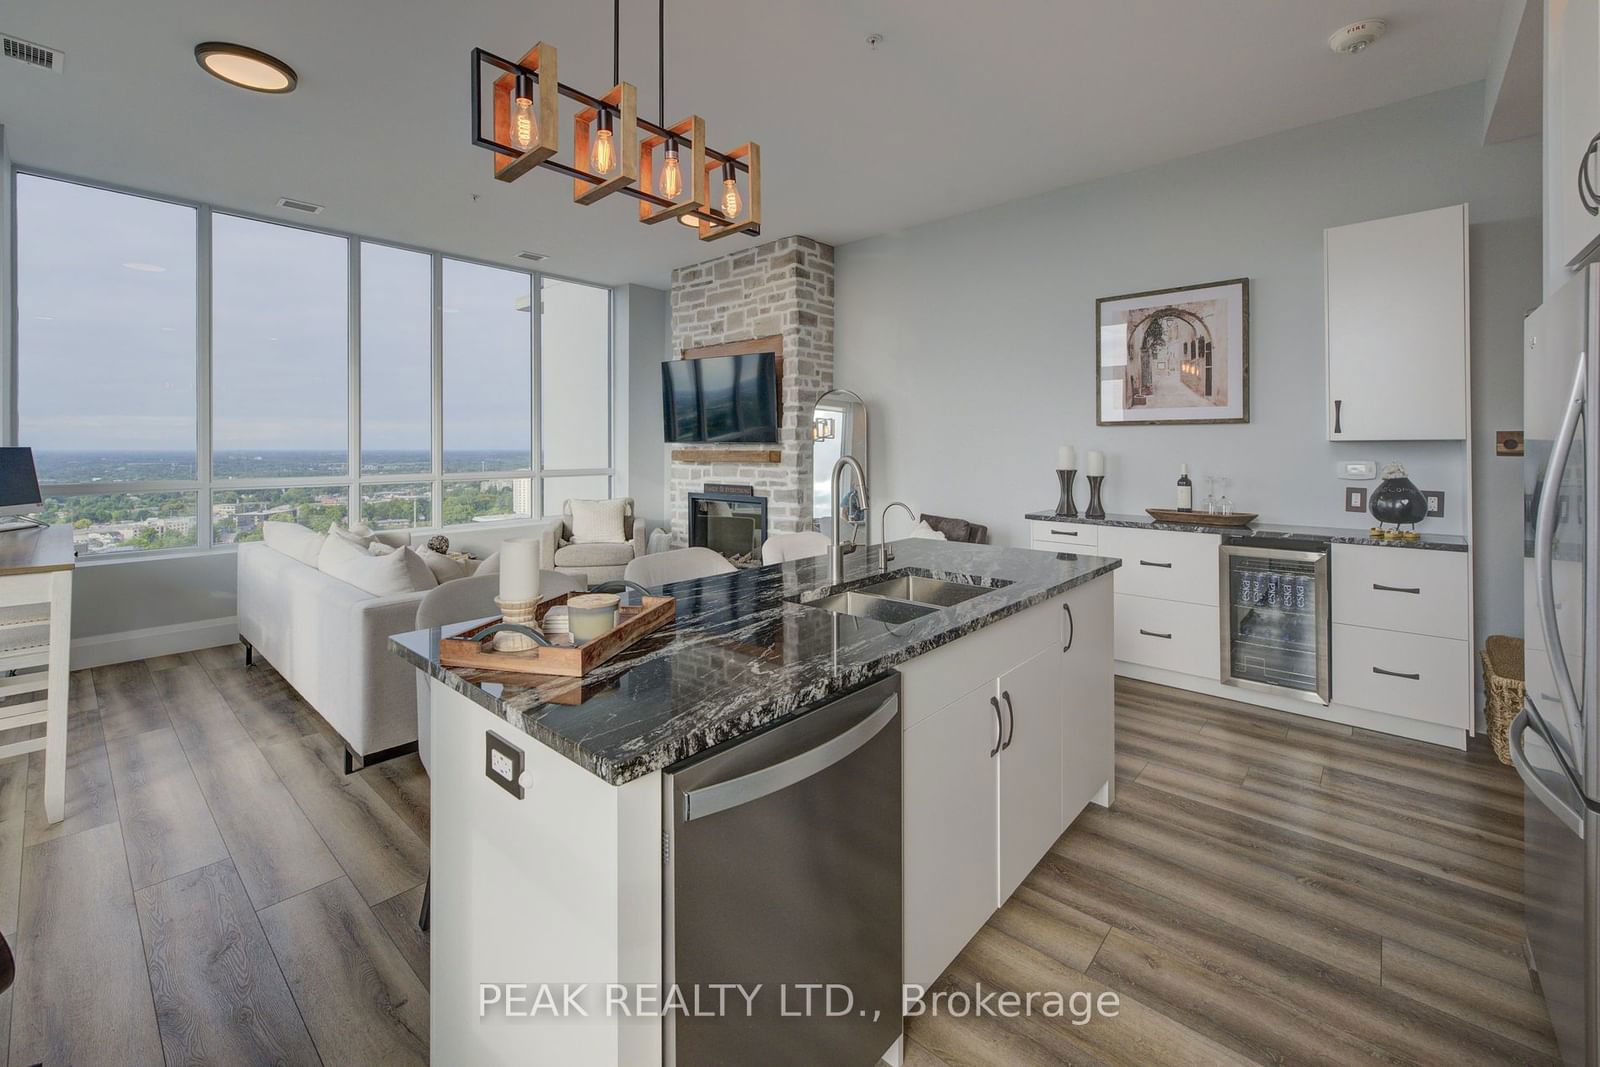
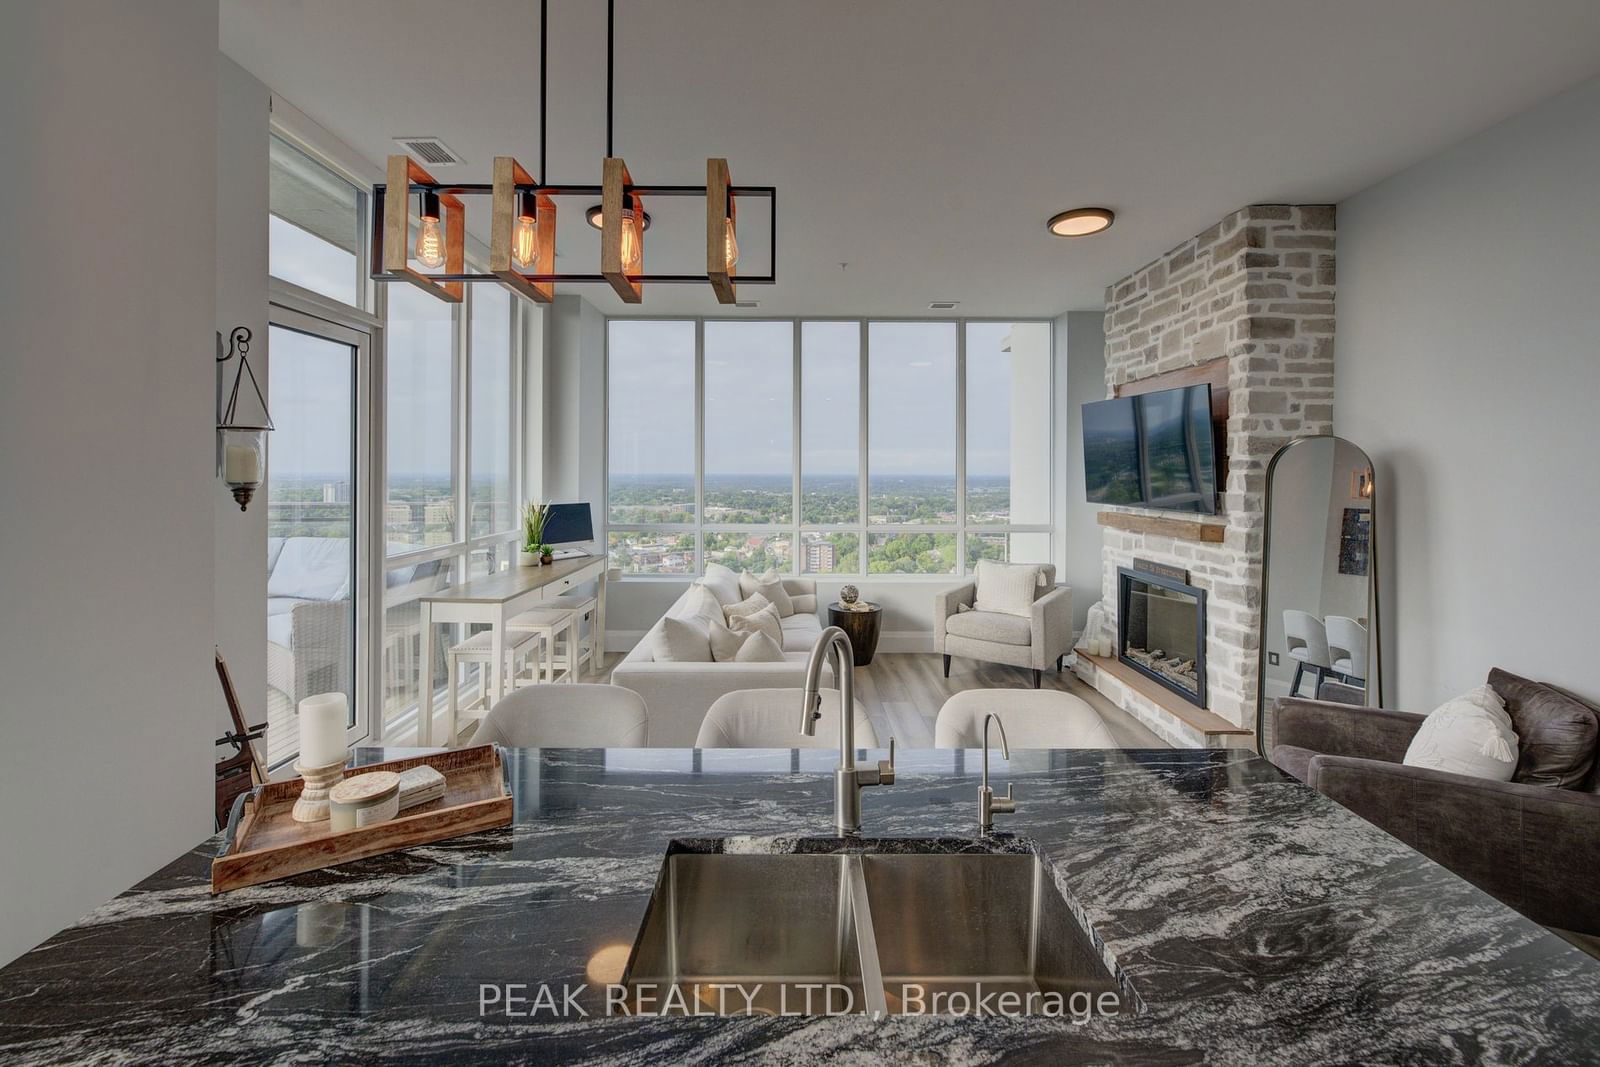
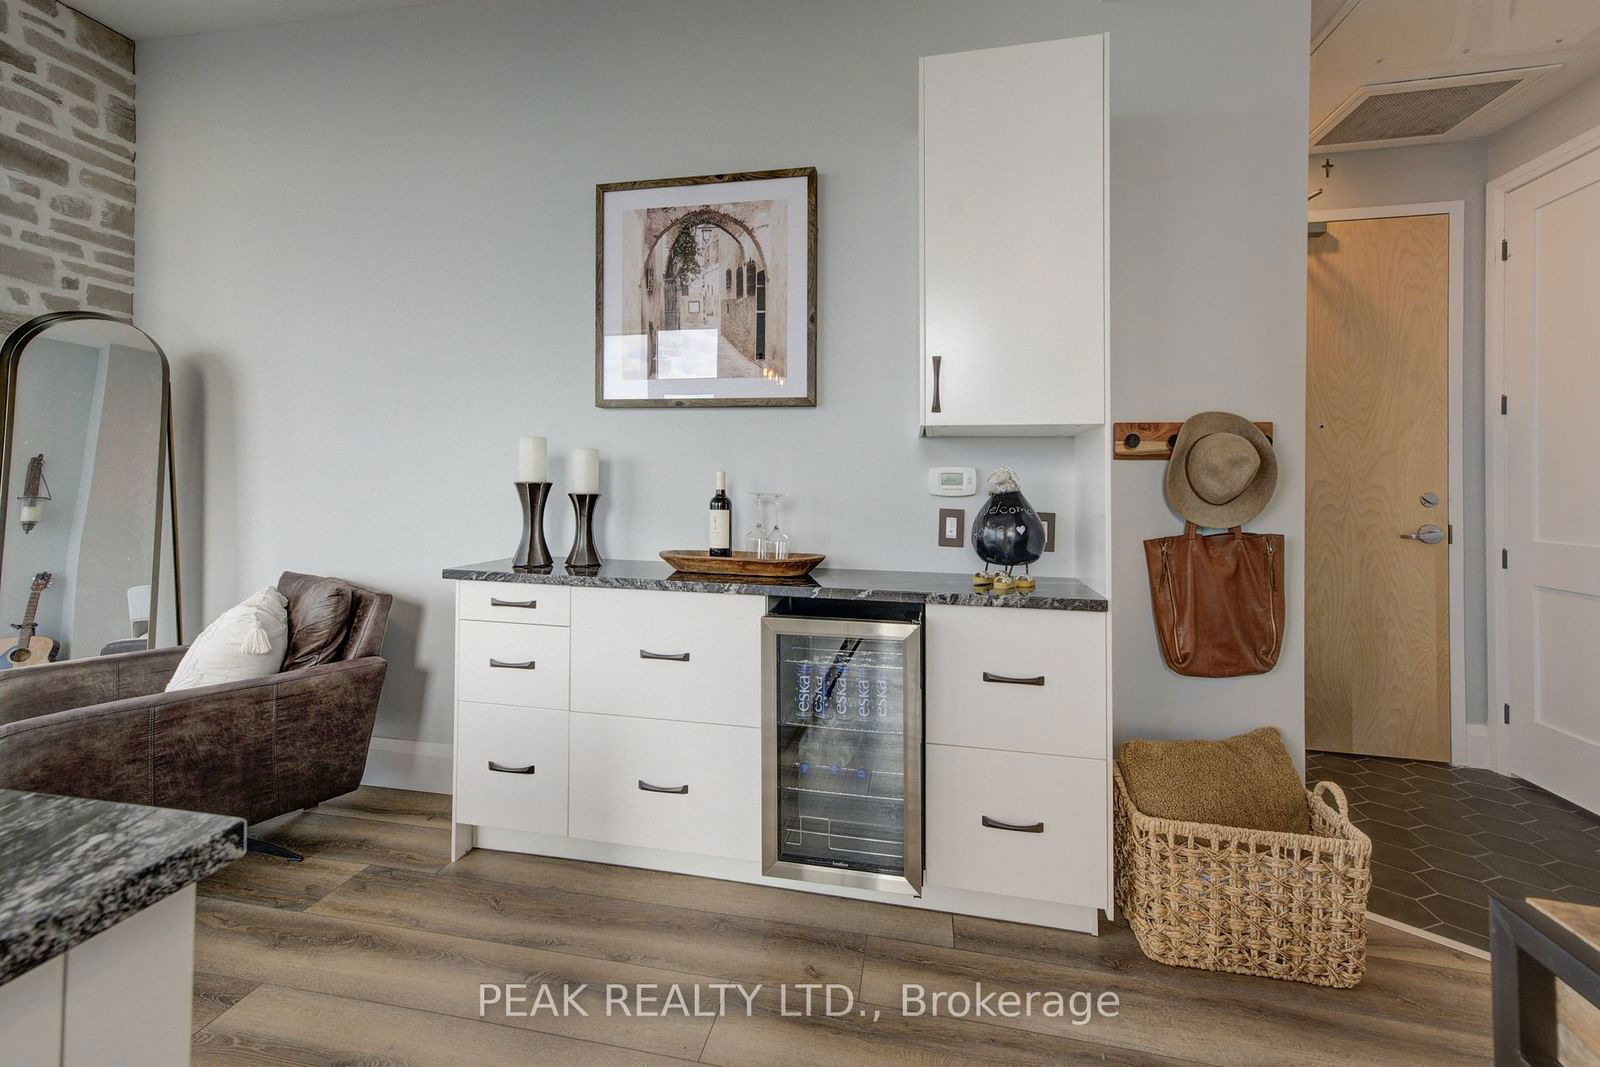
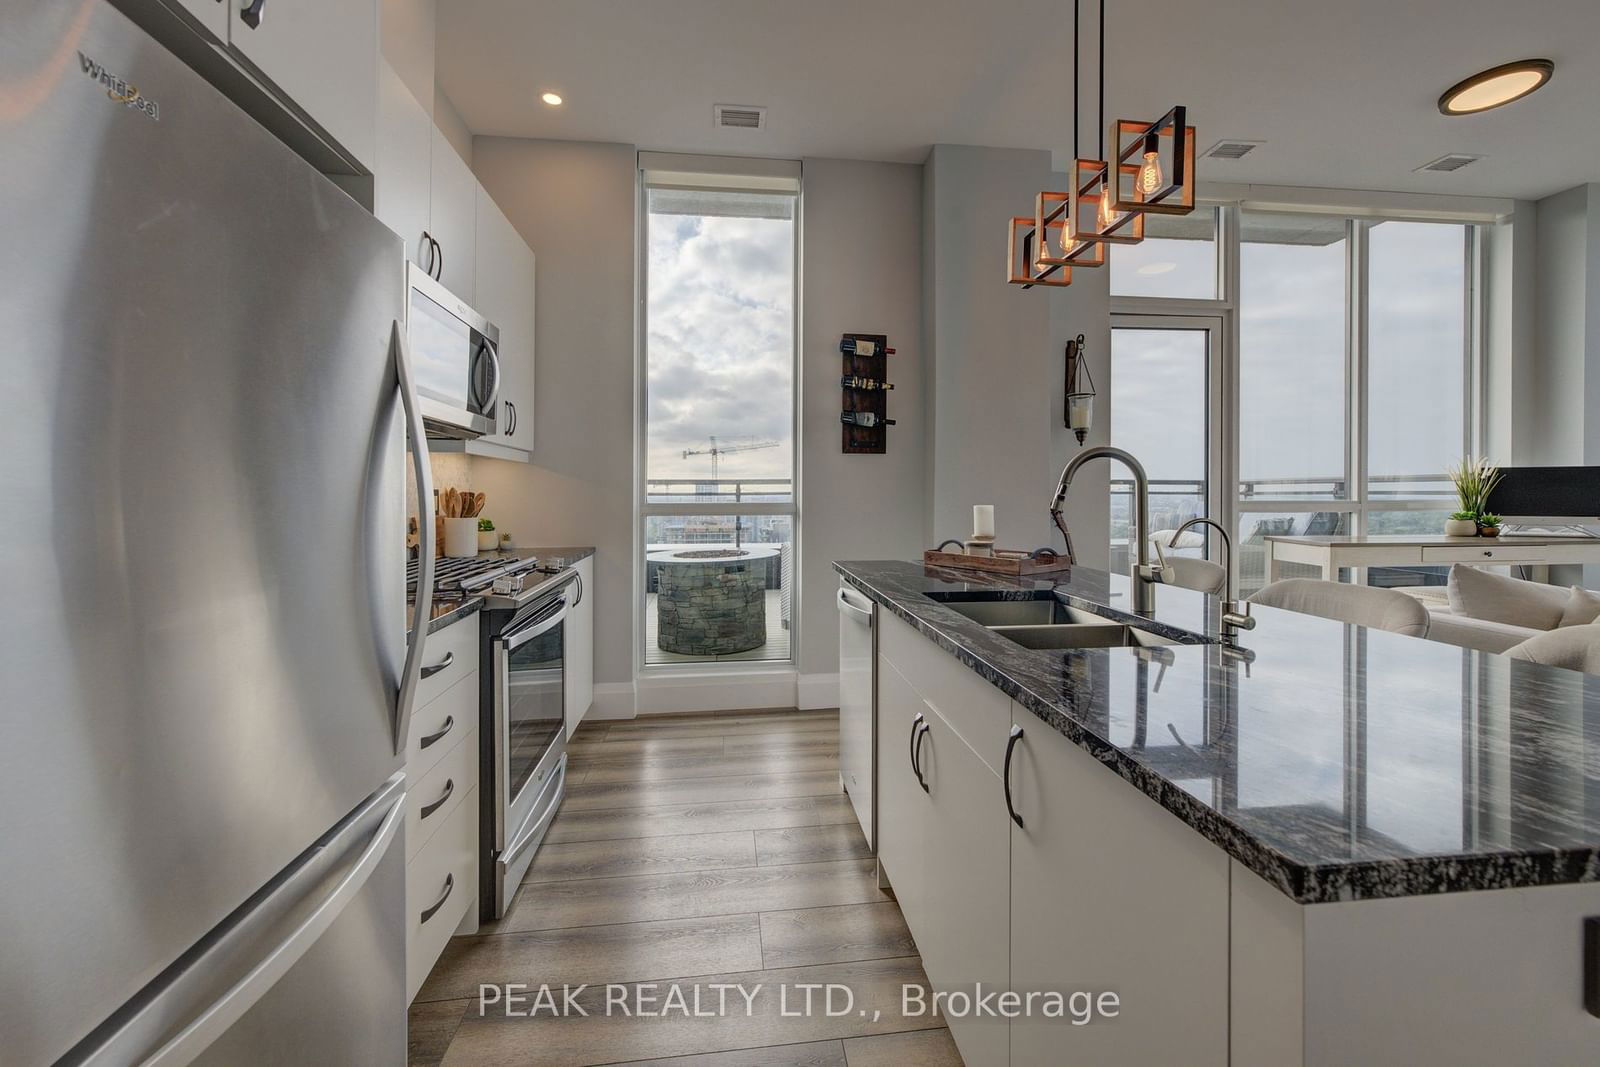
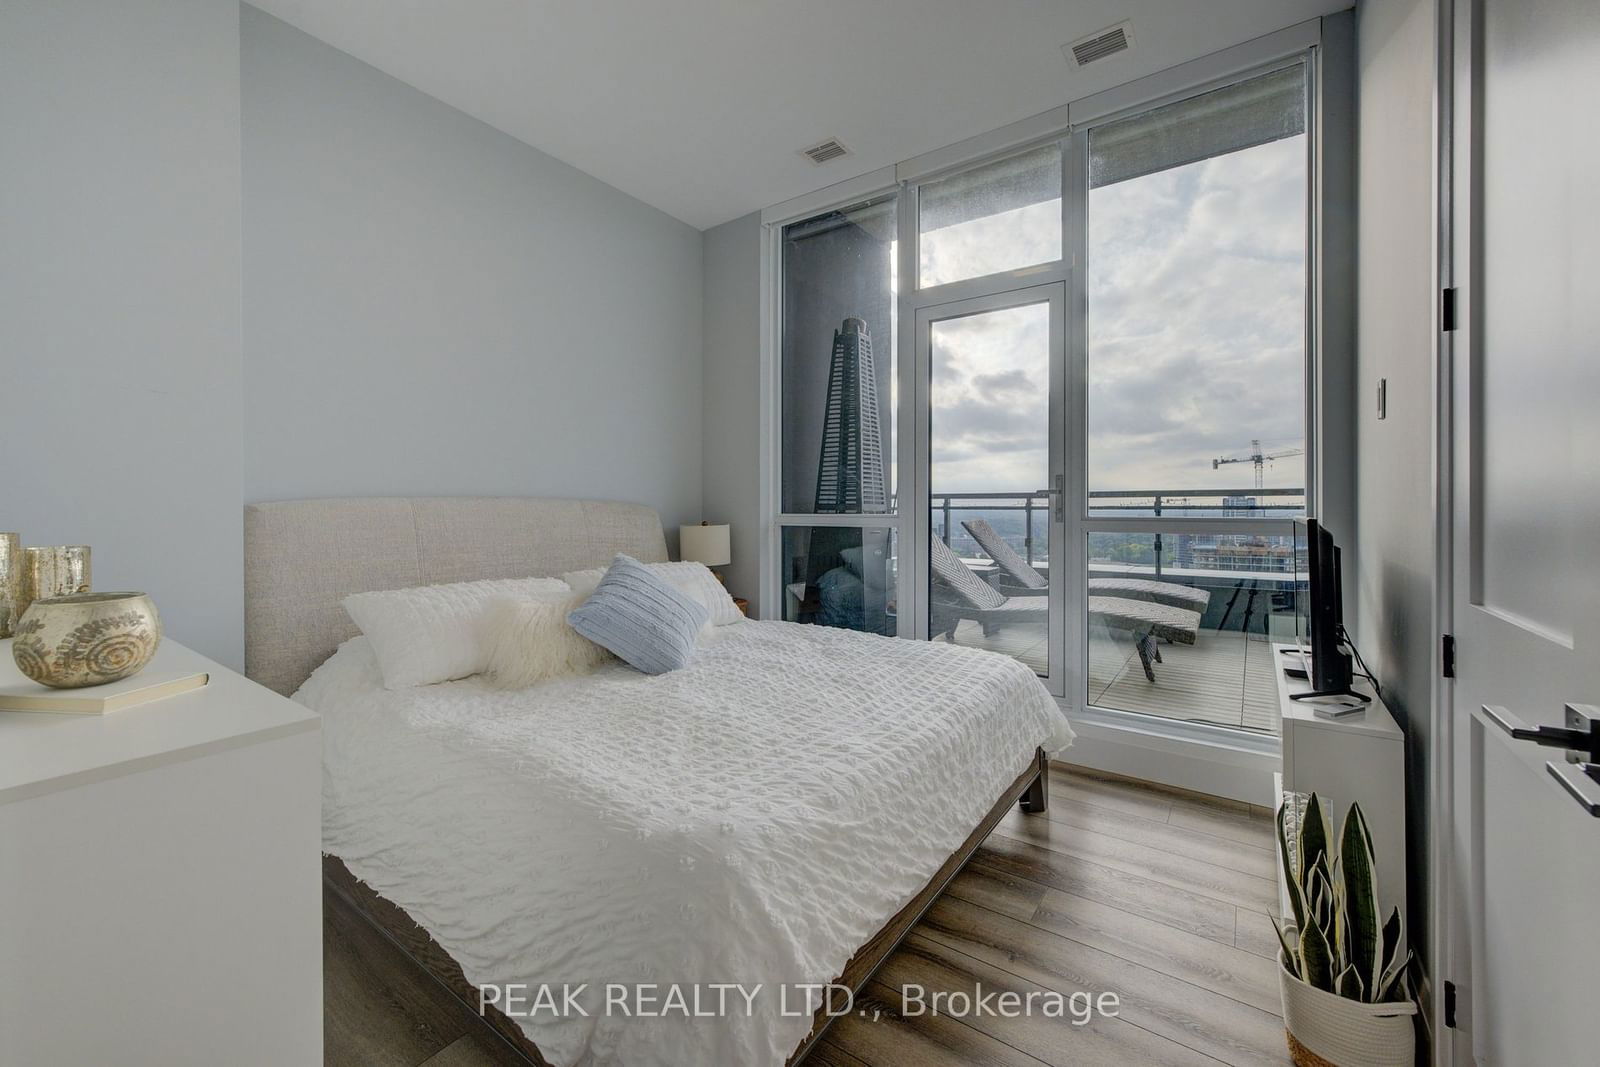
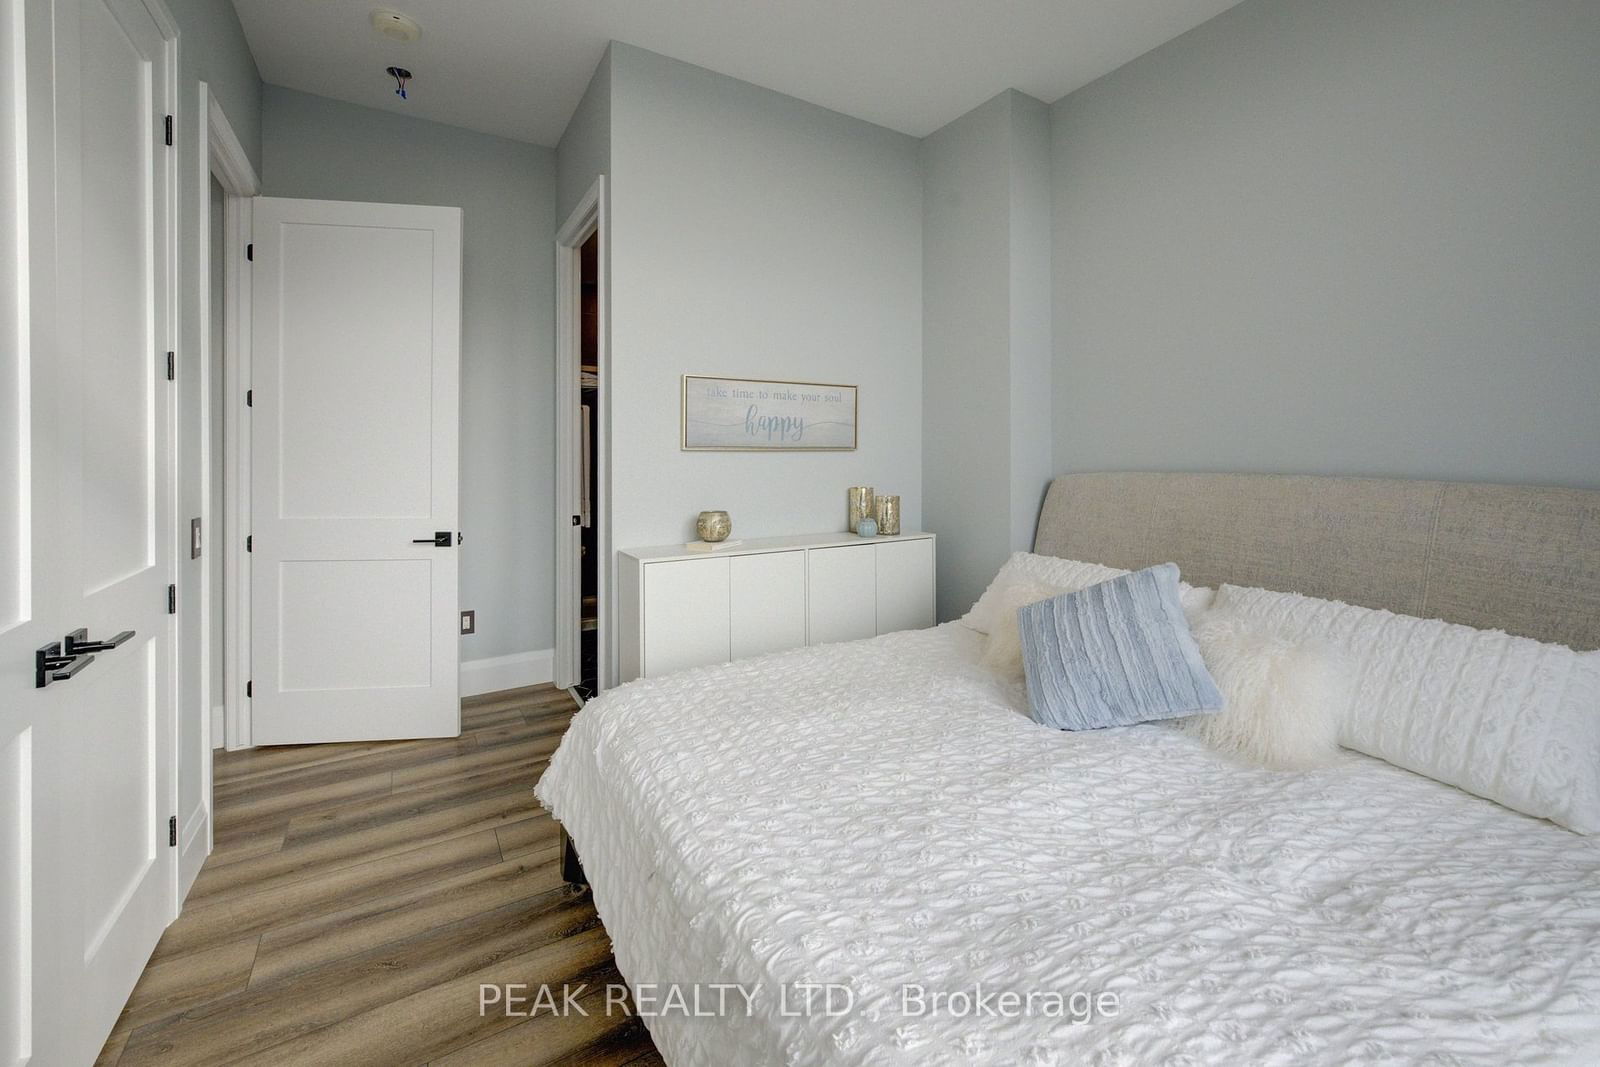
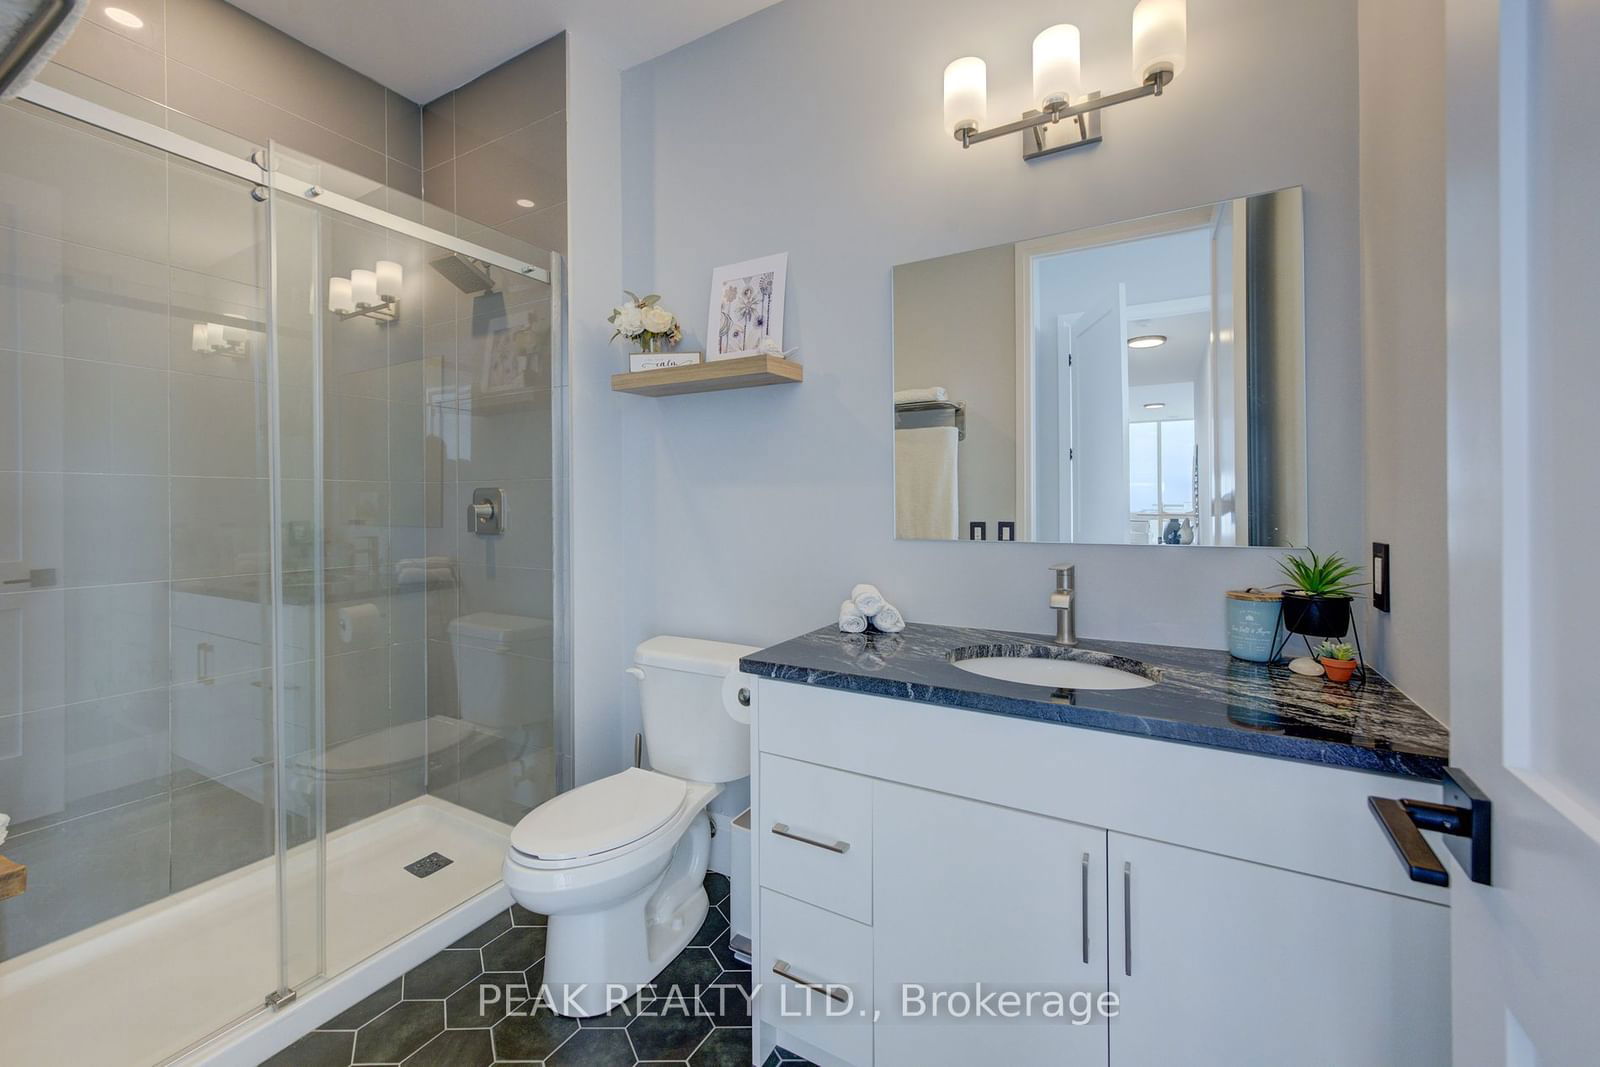
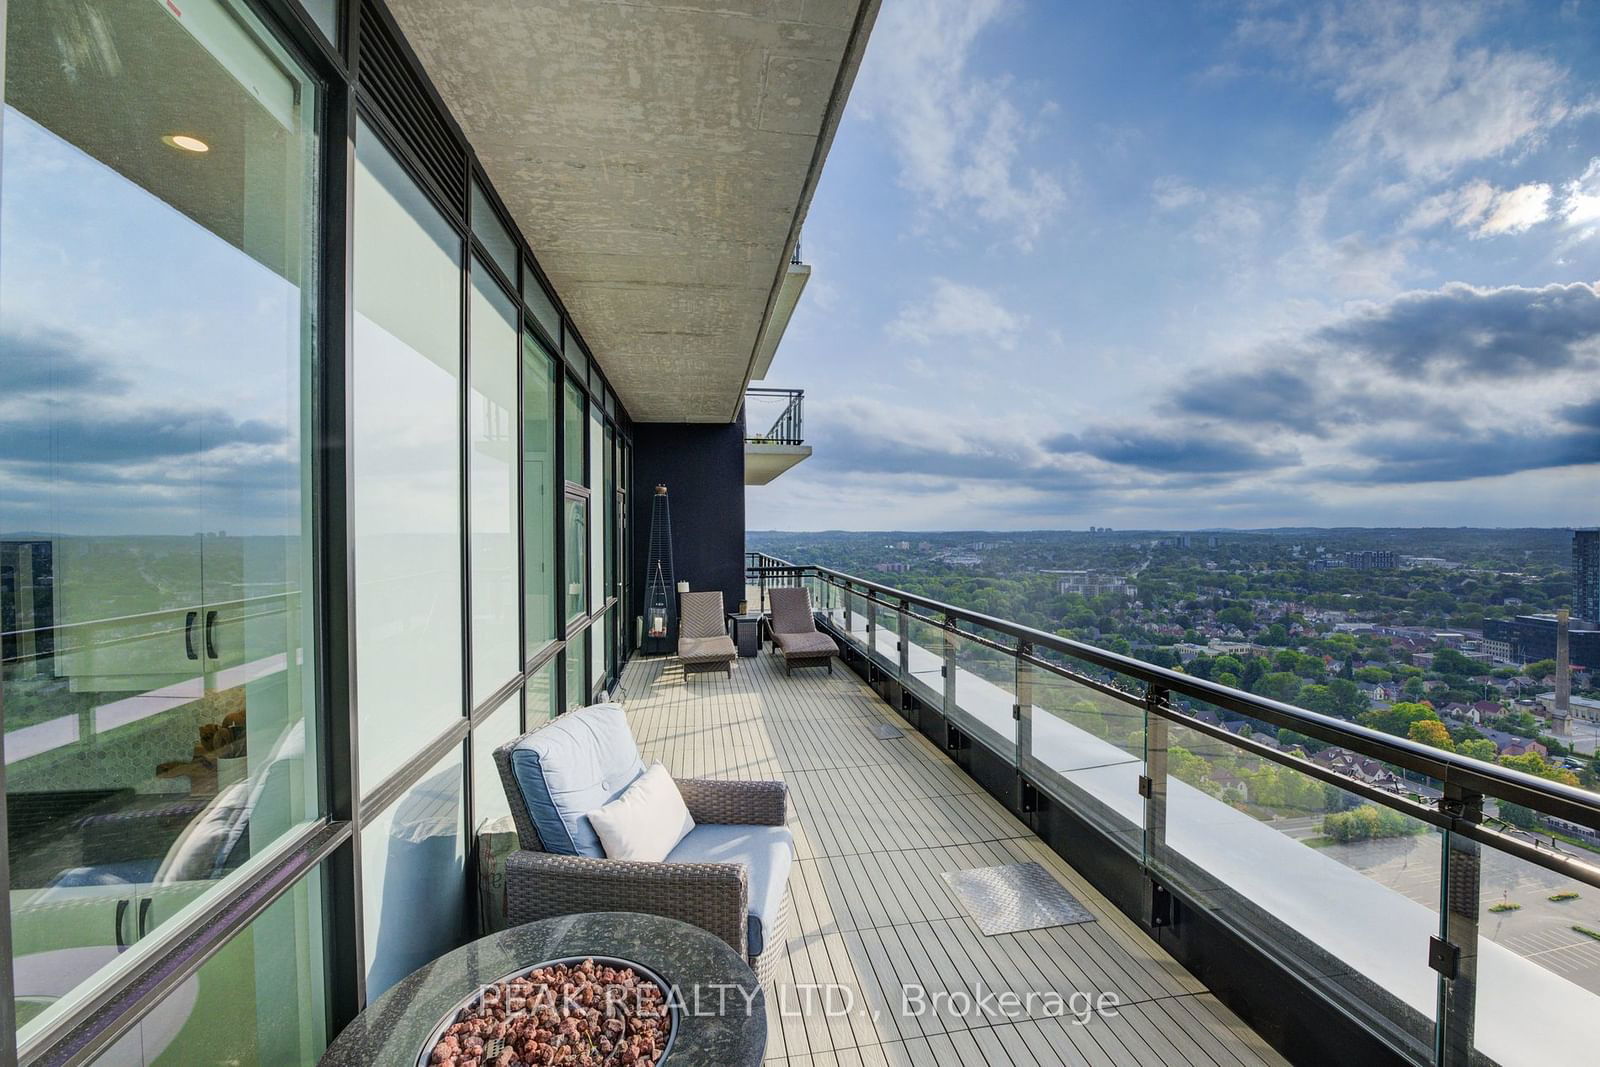
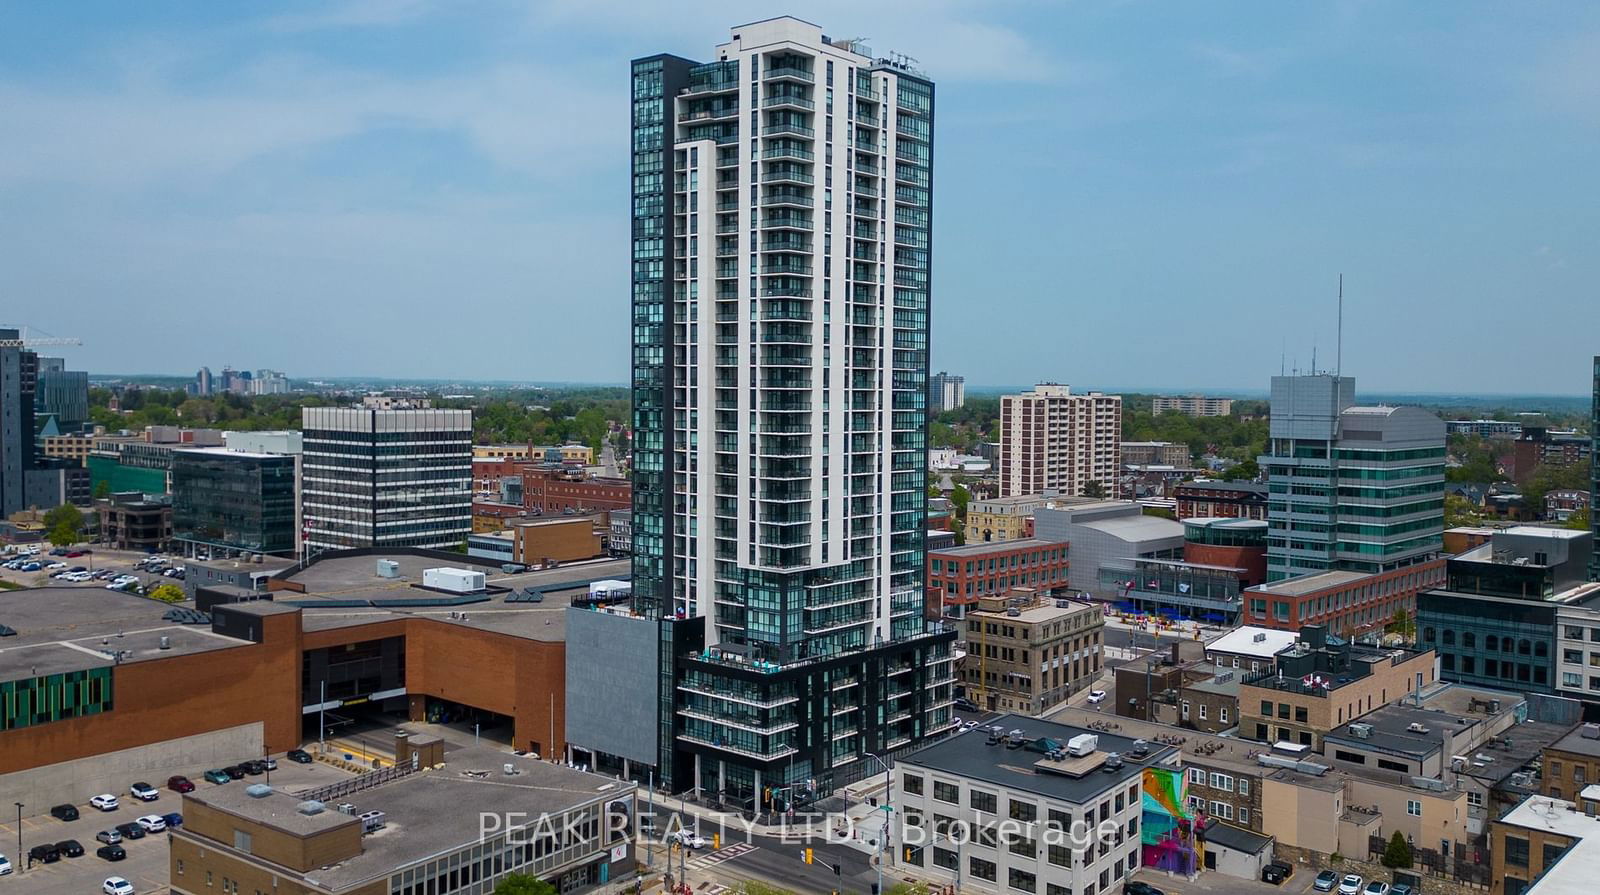
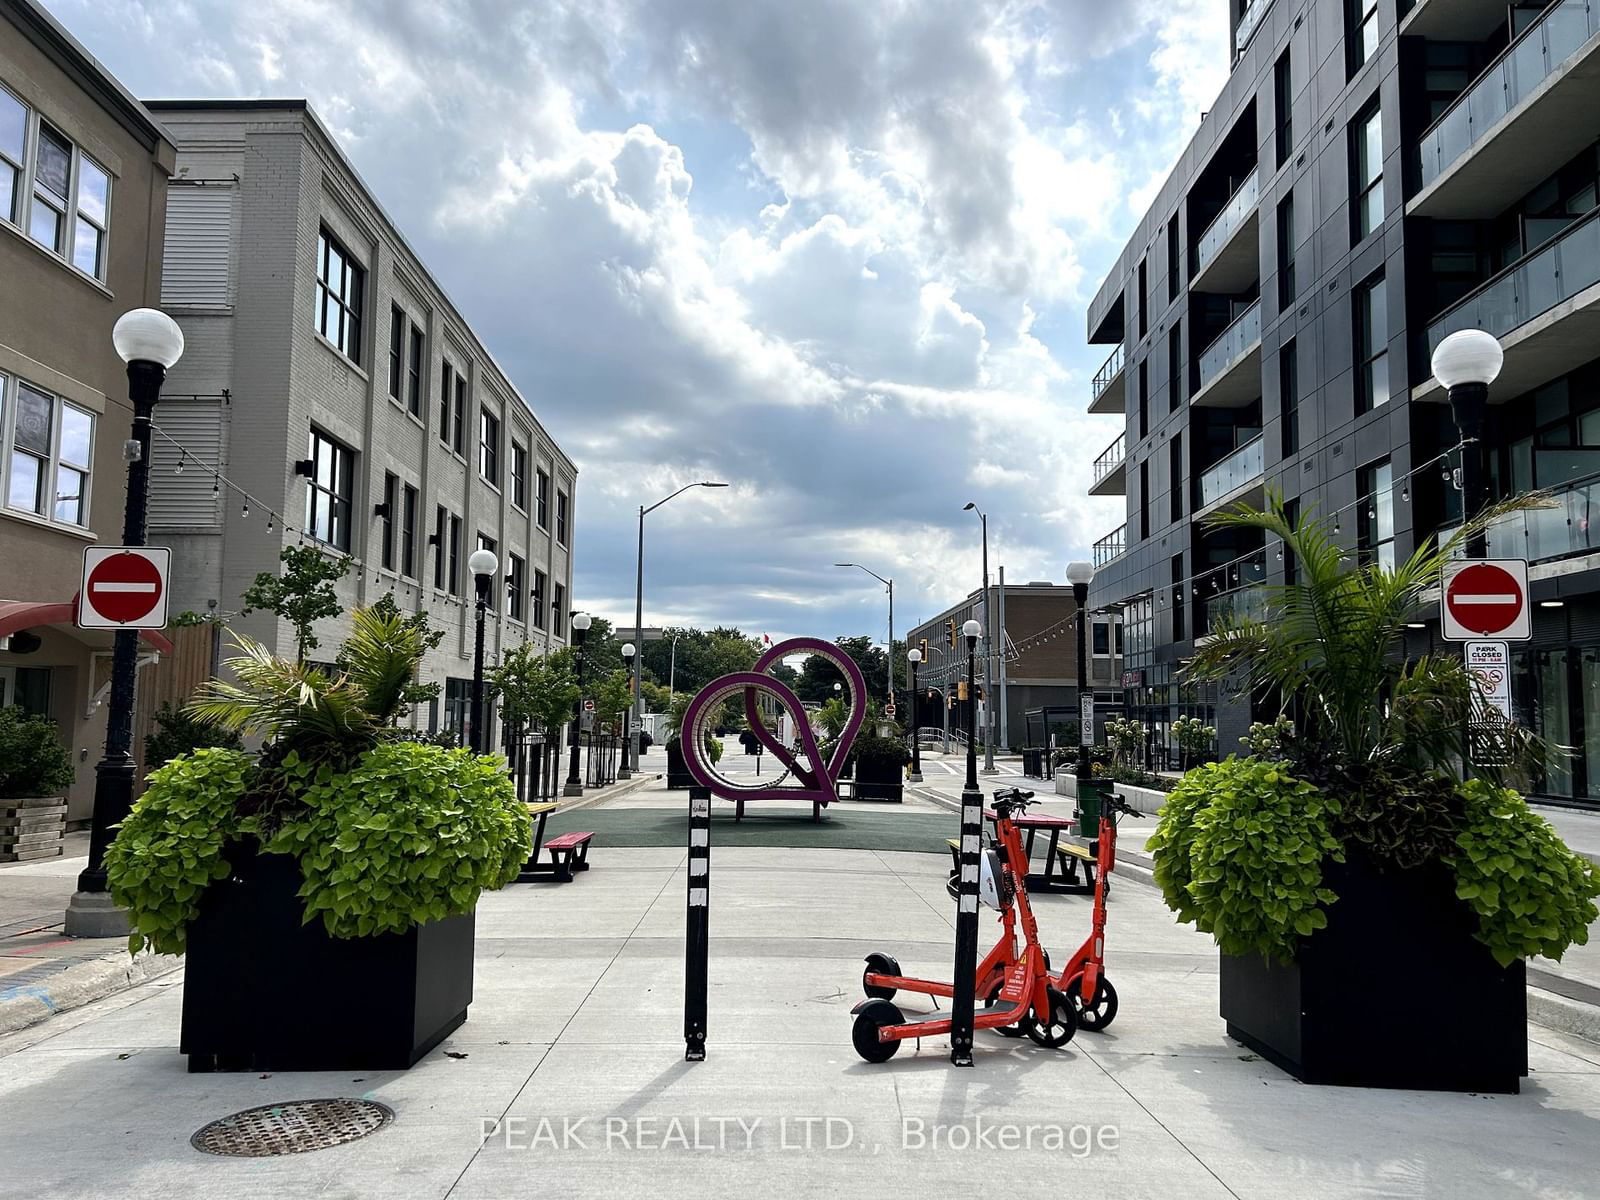
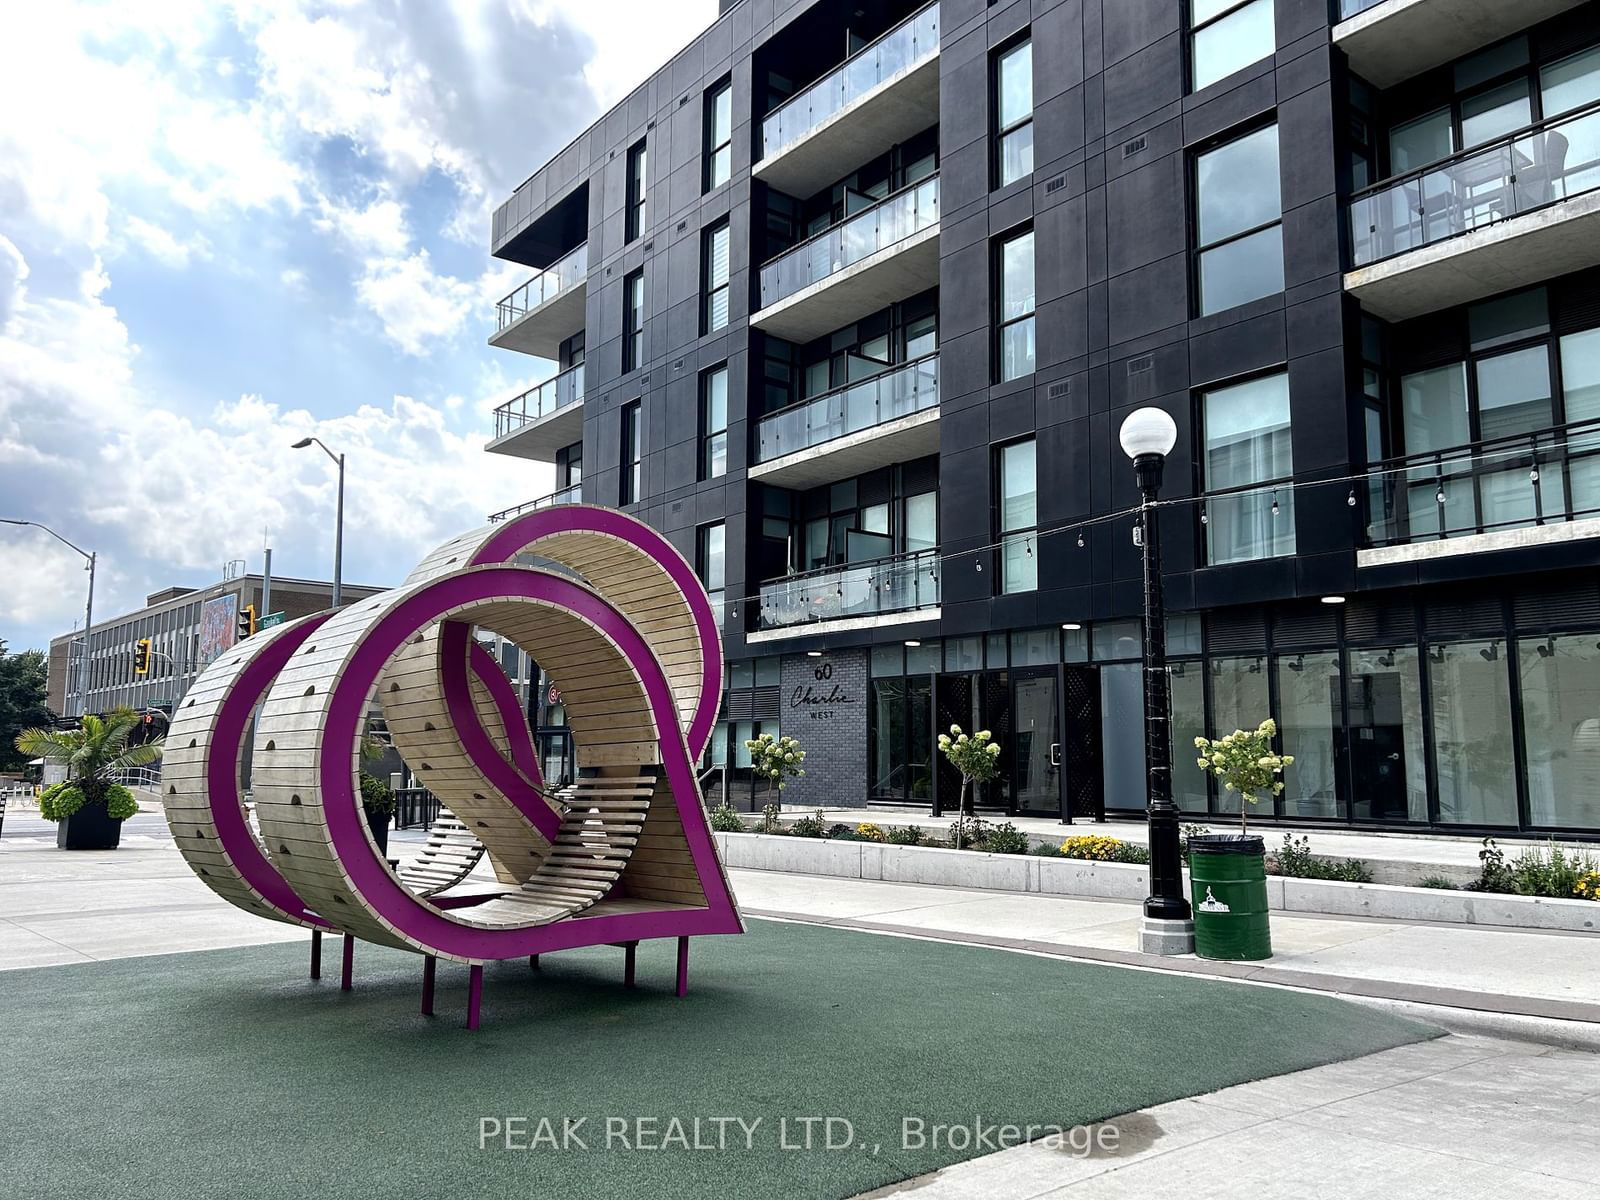
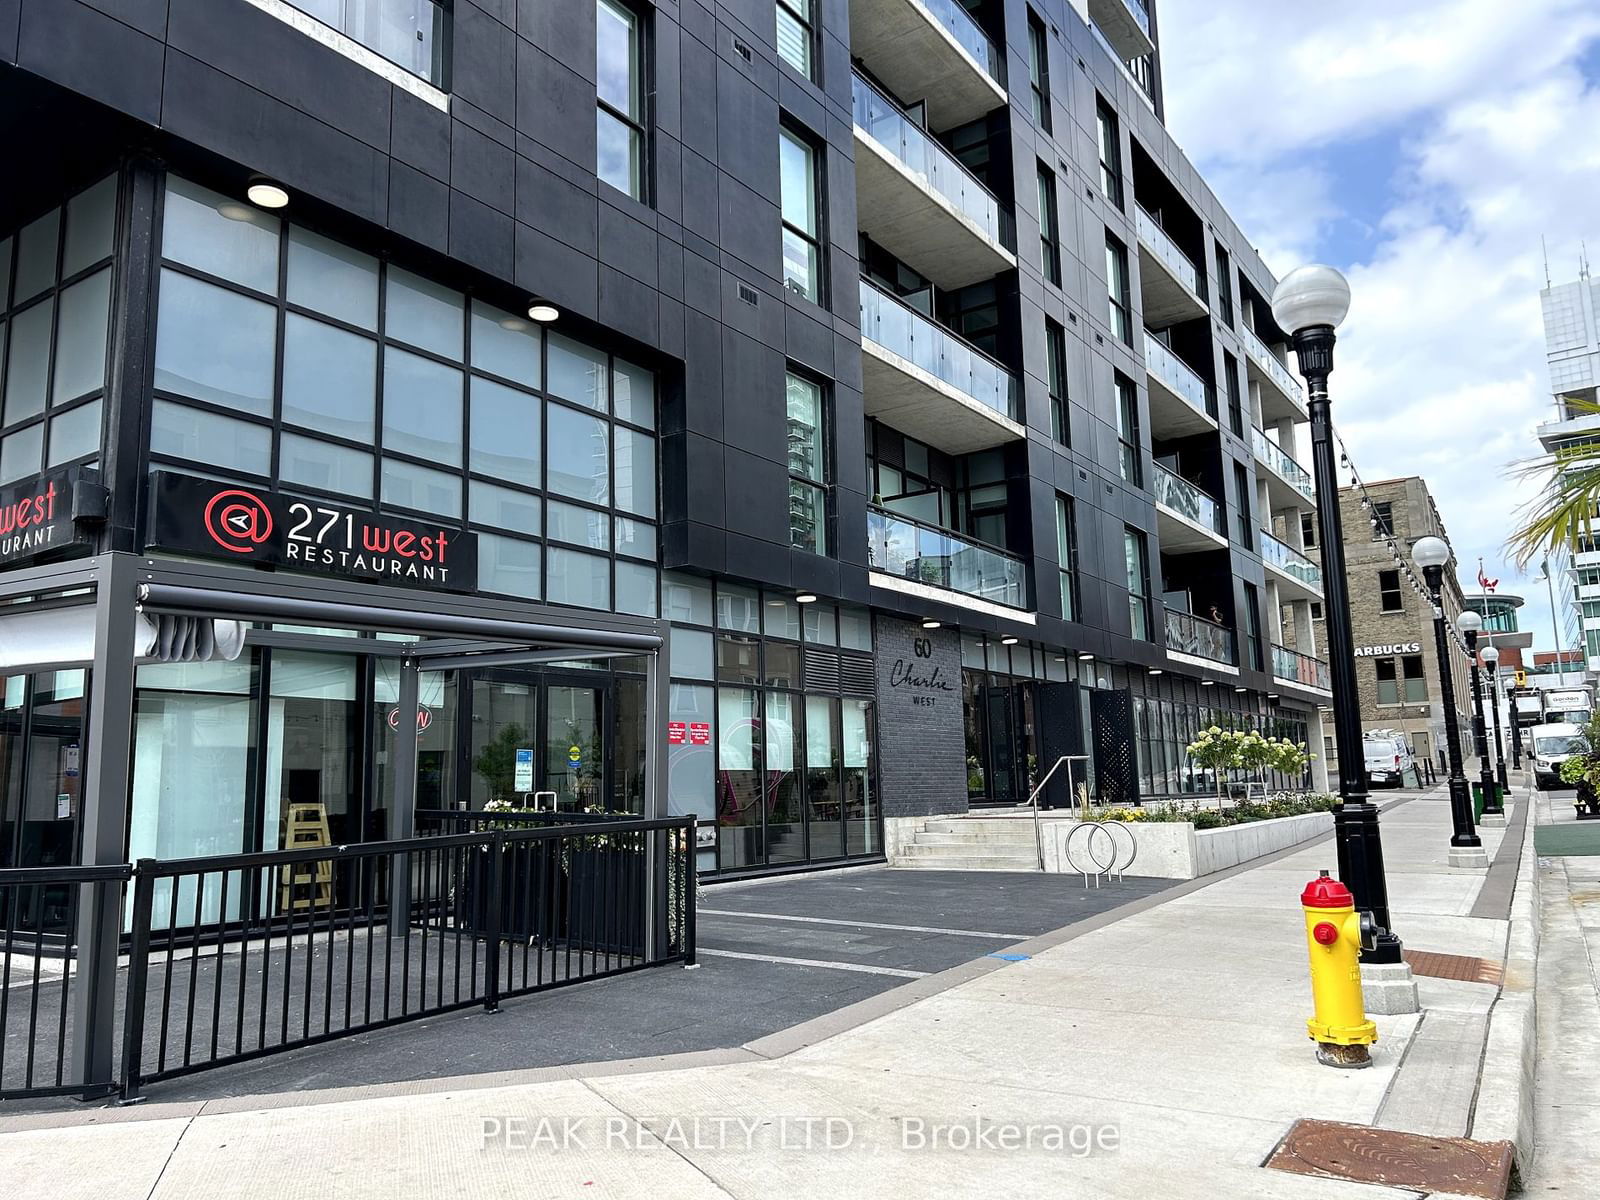
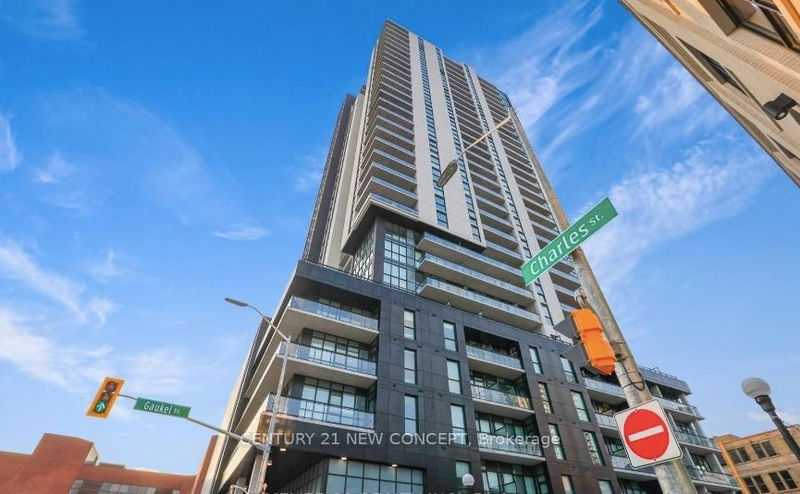
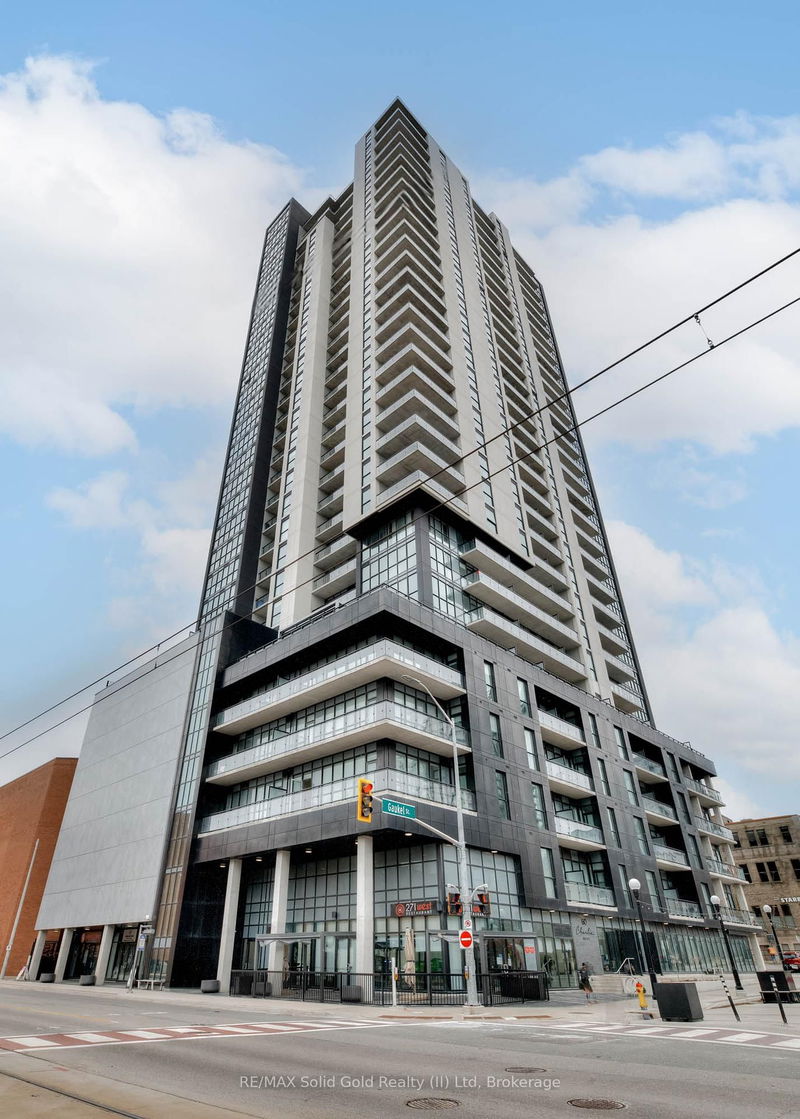
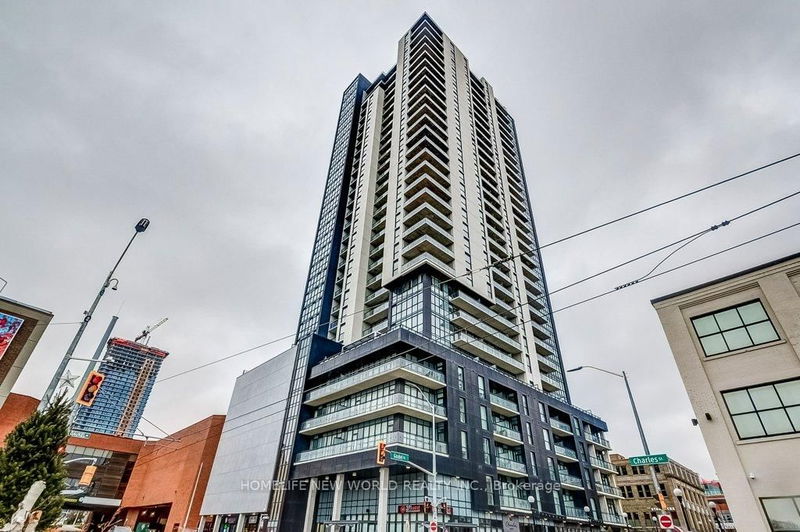
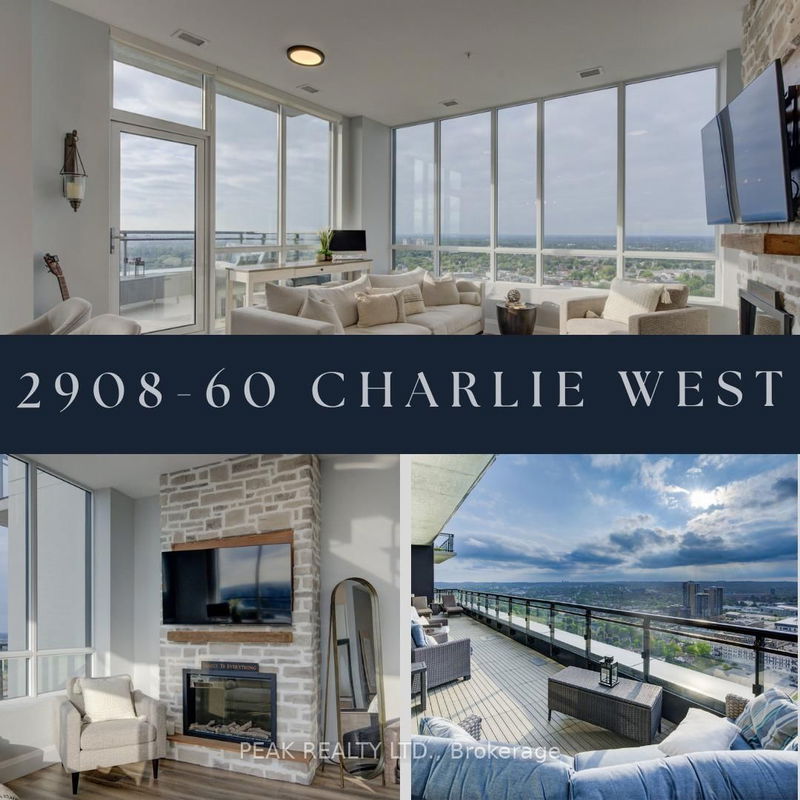
60 Charles Street W
Building Highlights
Property Type:
Condo
Number of Storeys:
31
Number of Units:
305
Condo Completion:
2021
Condo Demand:
Medium
Unit Size Range:
502 - 1,192 SQFT
Unit Availability:
Low
Property Management:
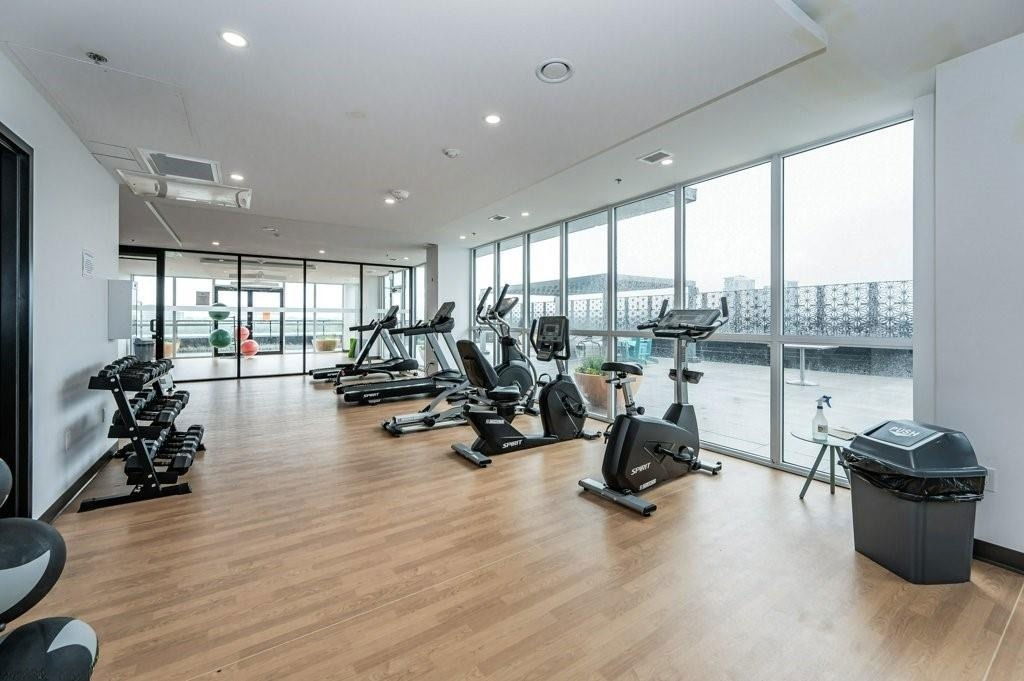
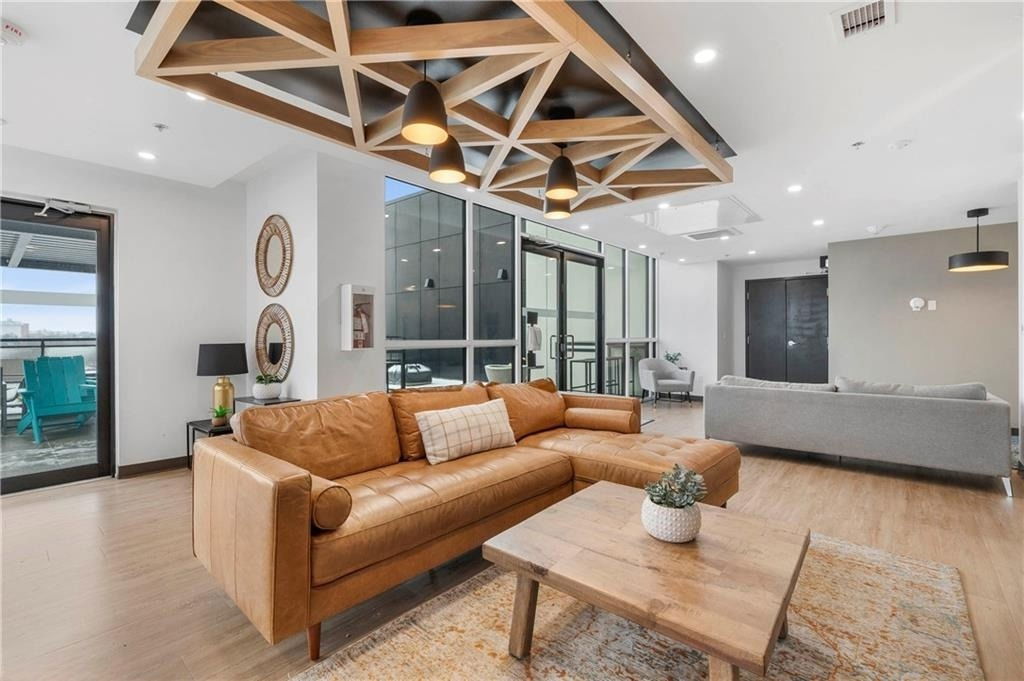
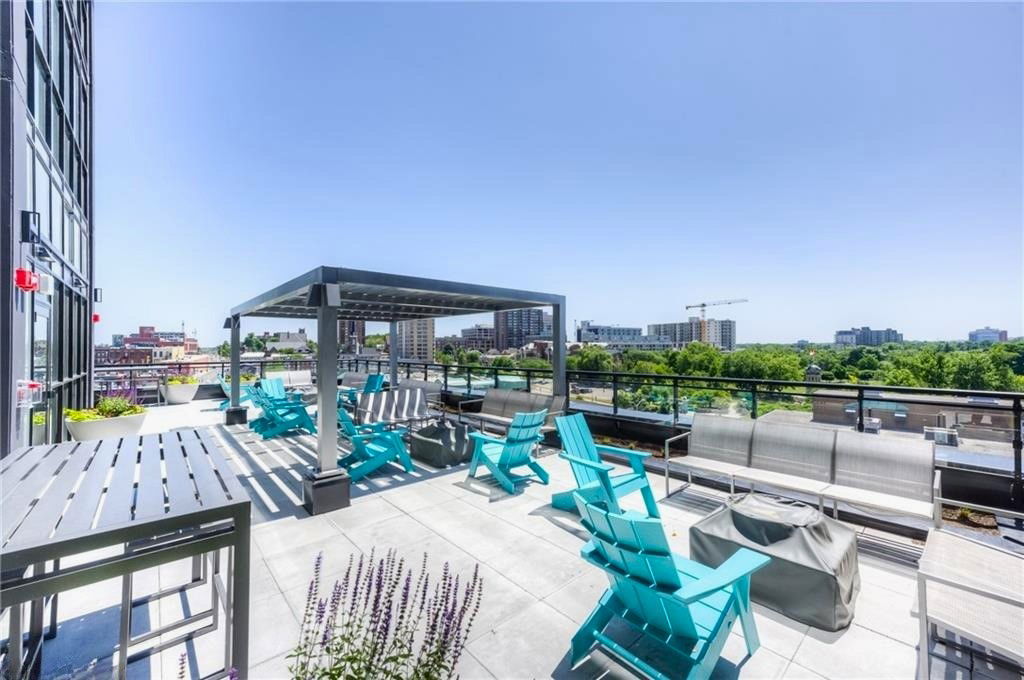
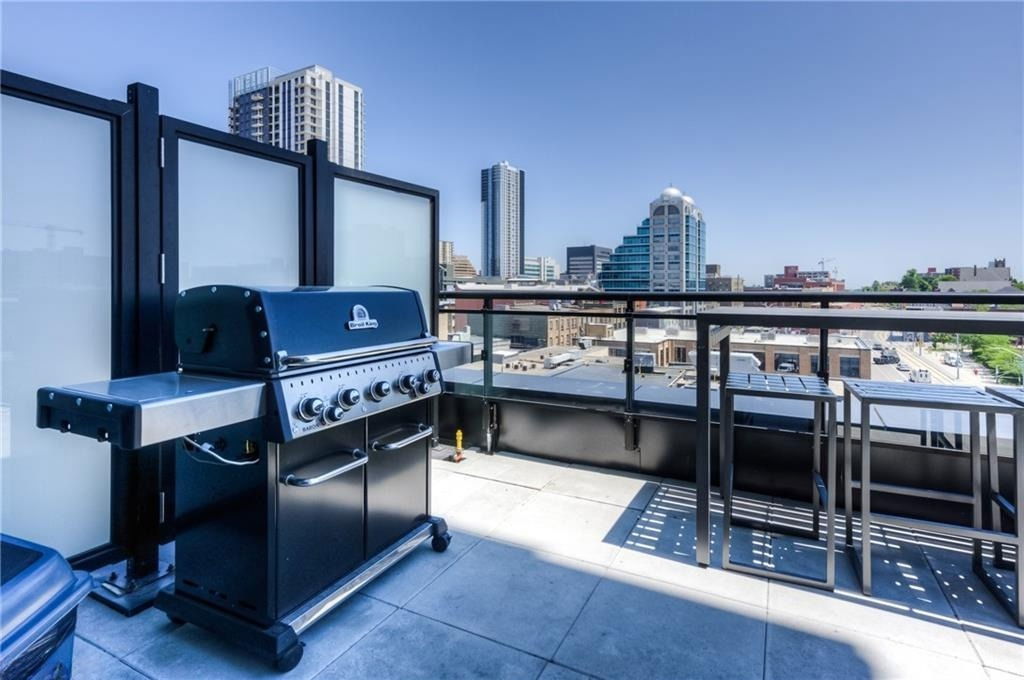
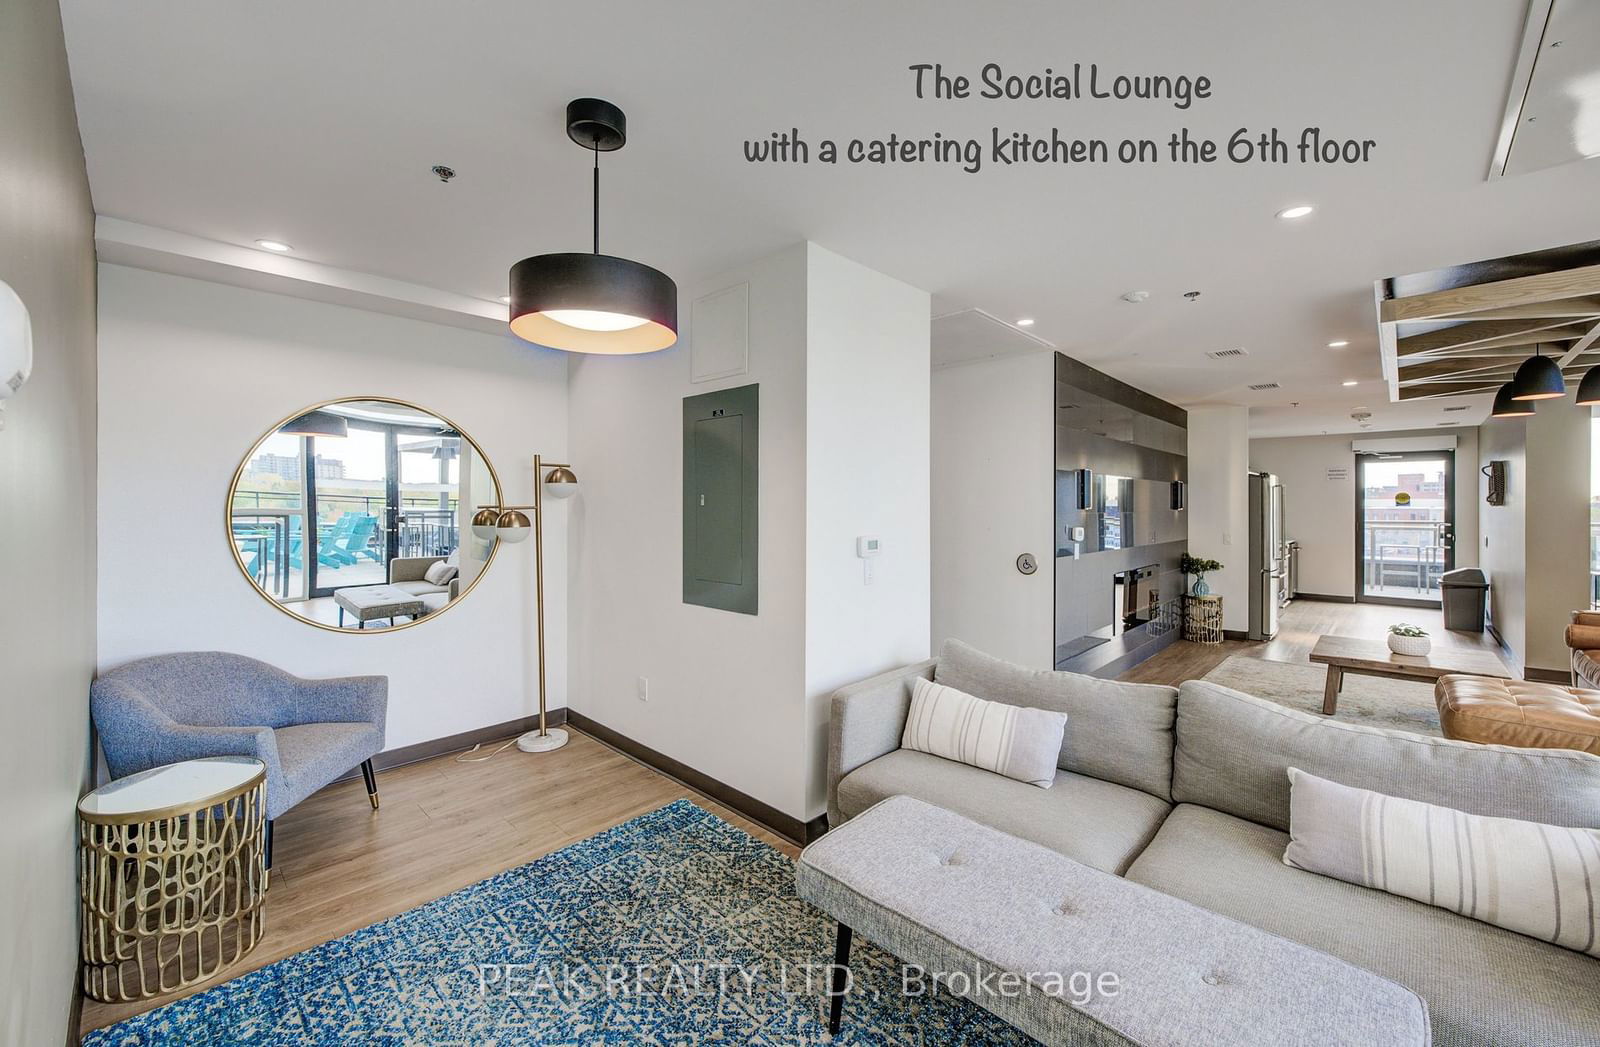
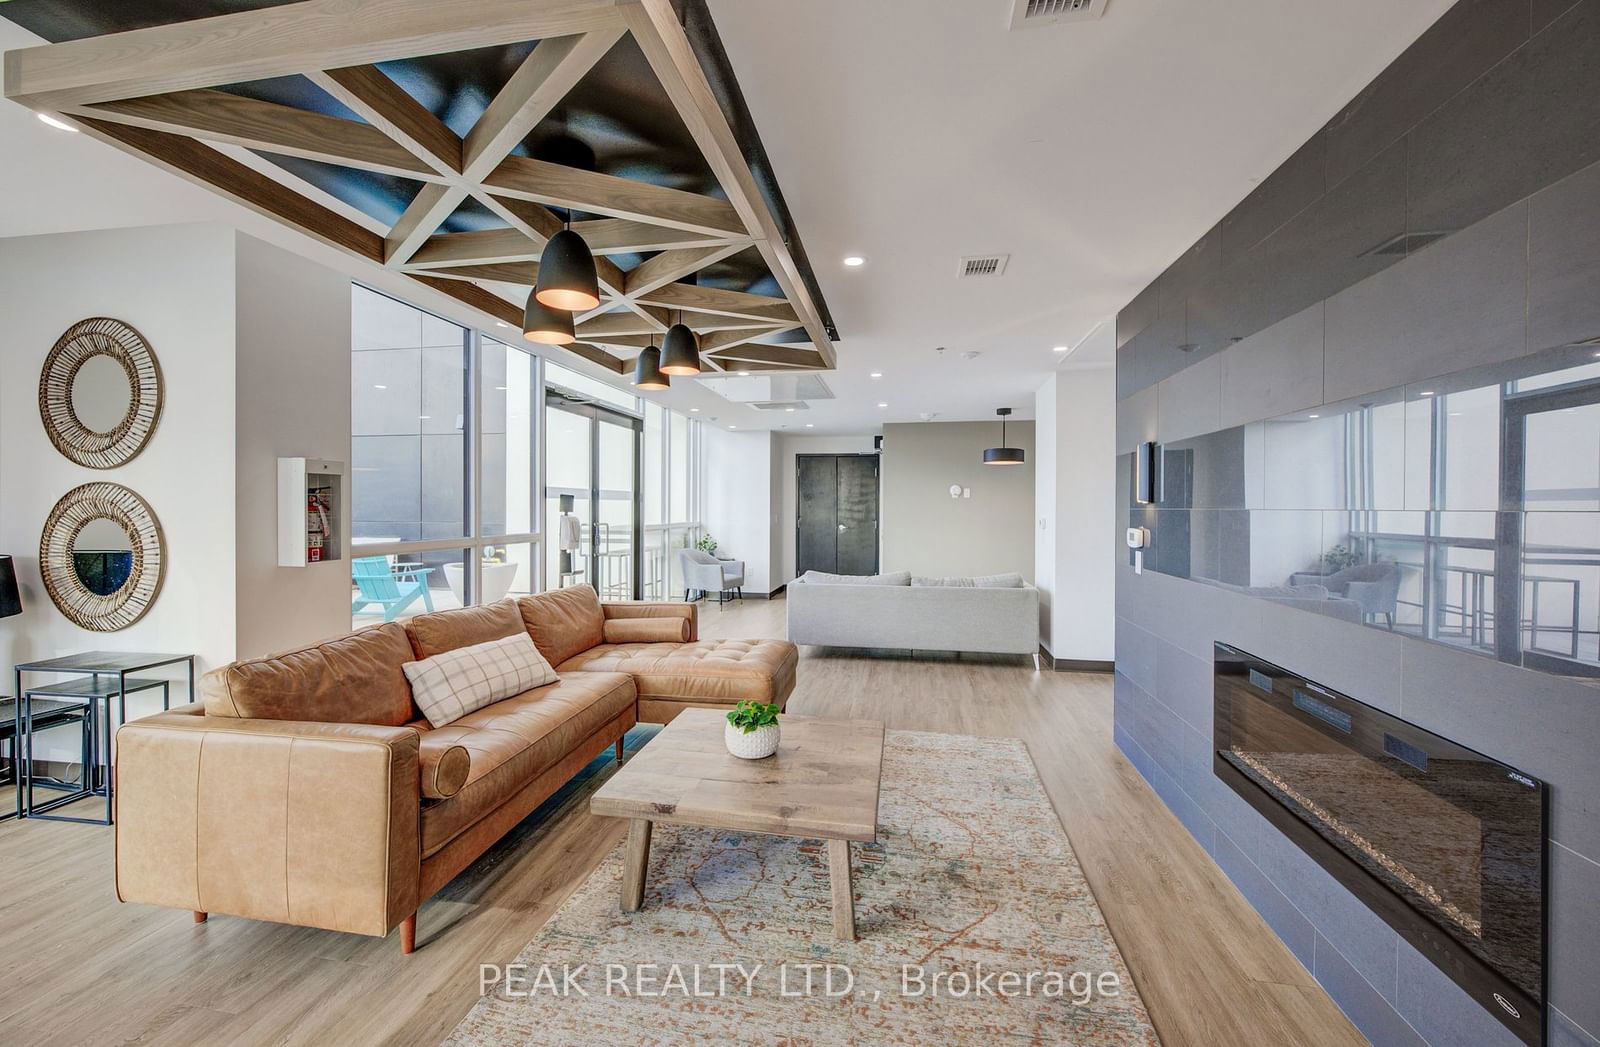
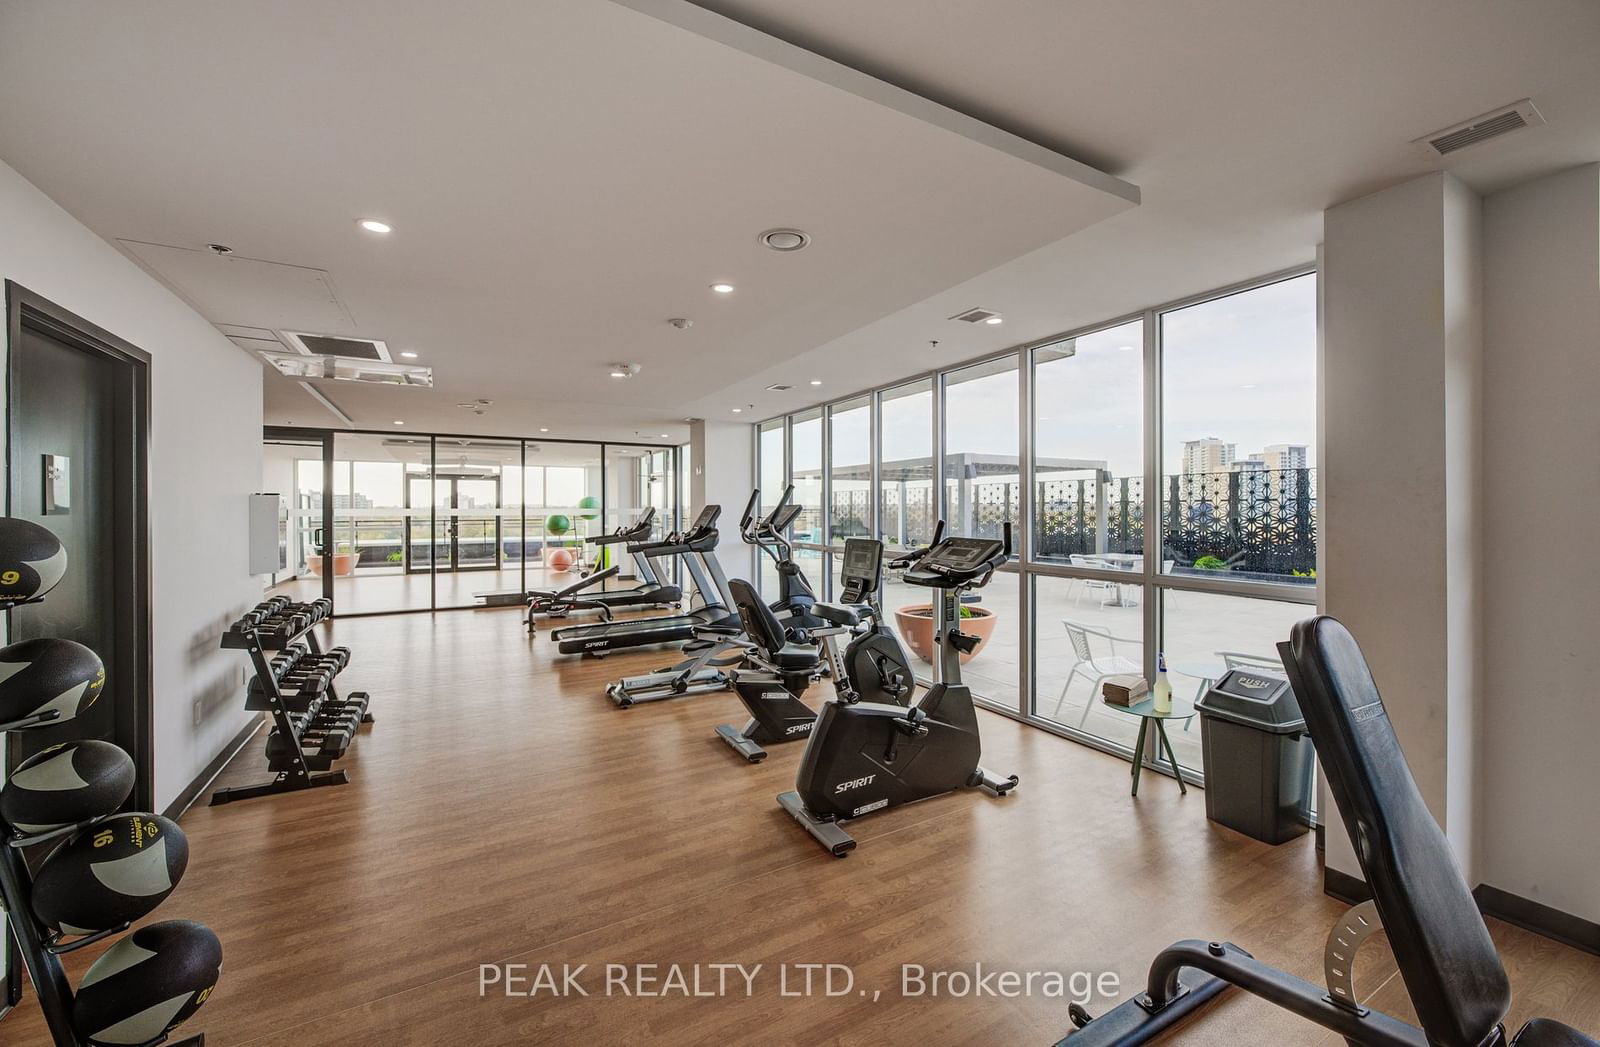
Amenities
About 60 Charles Street W — Charlie West
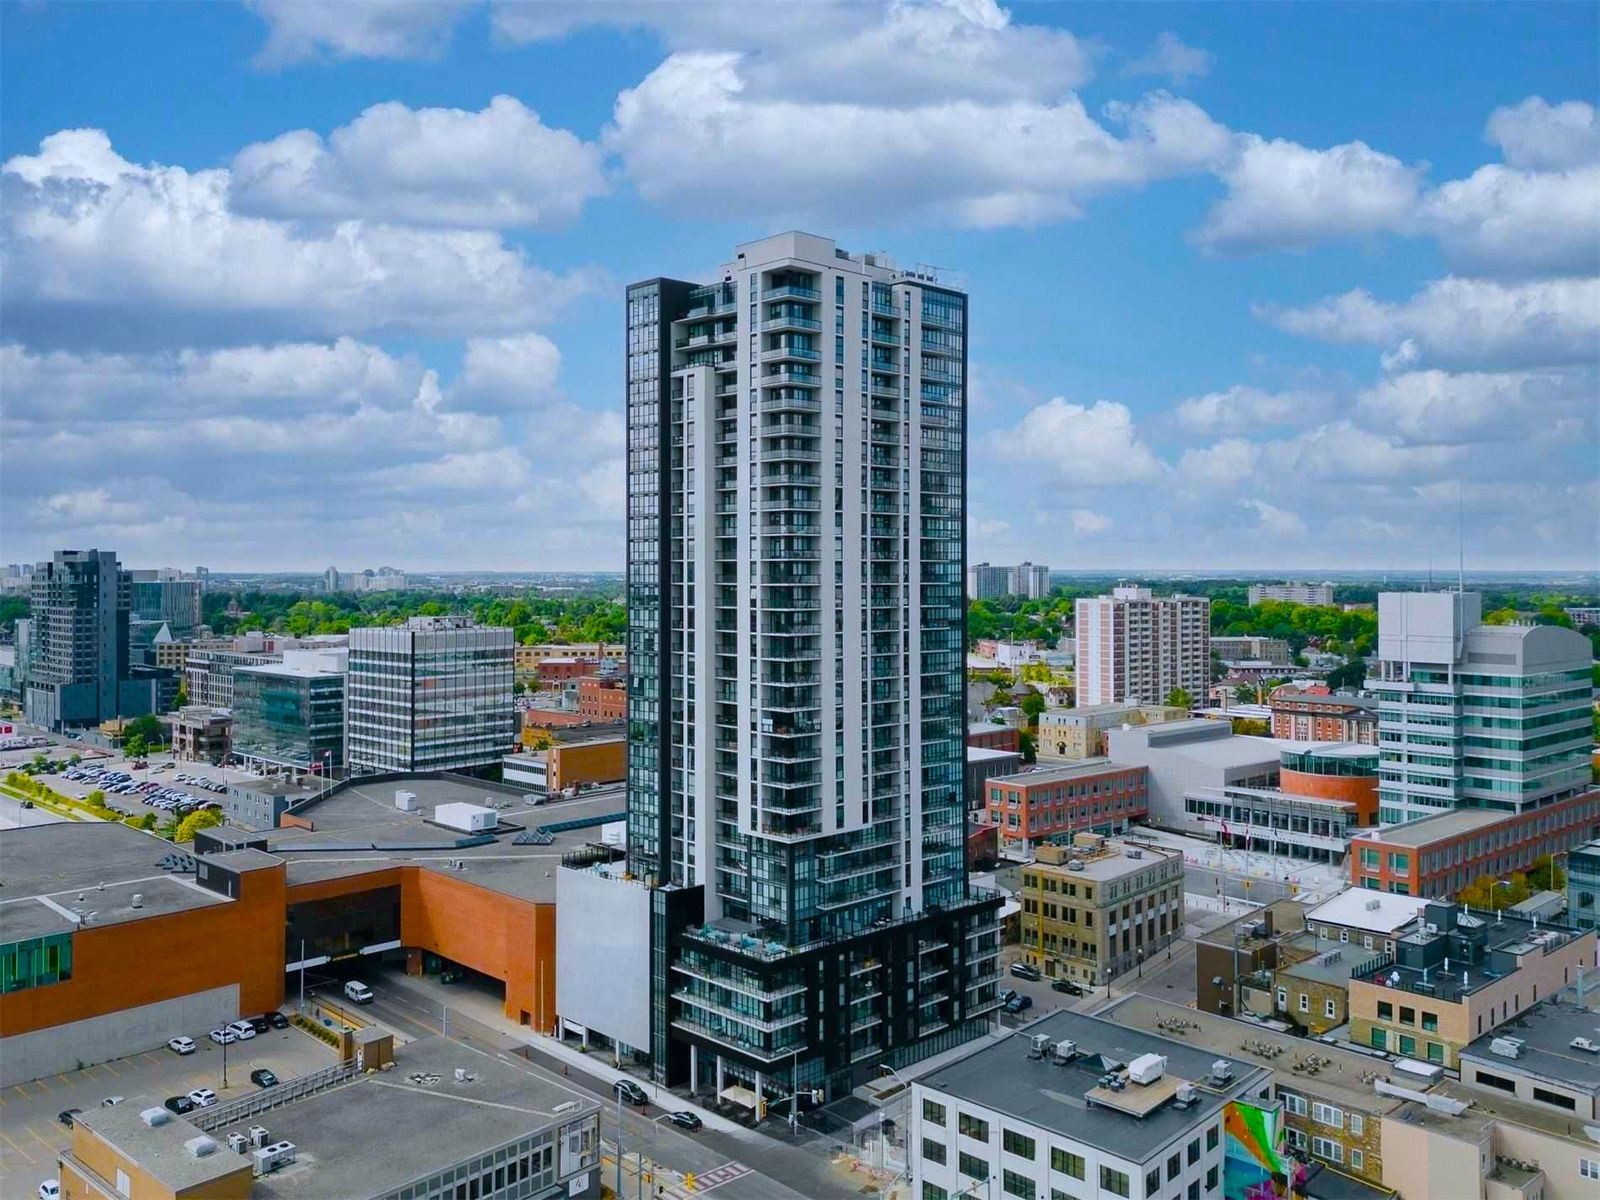
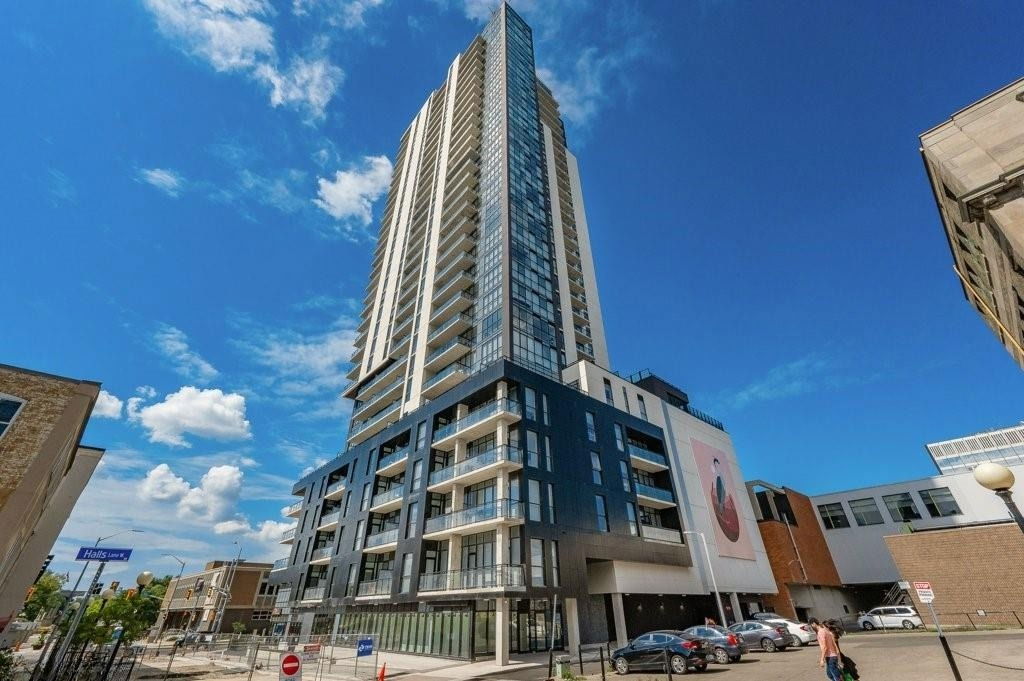
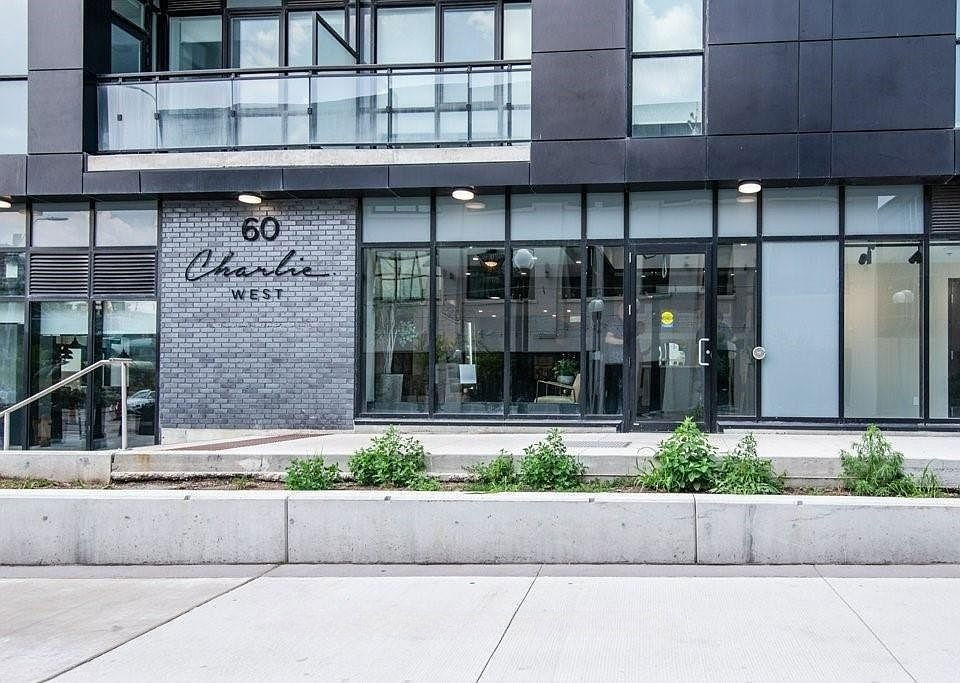
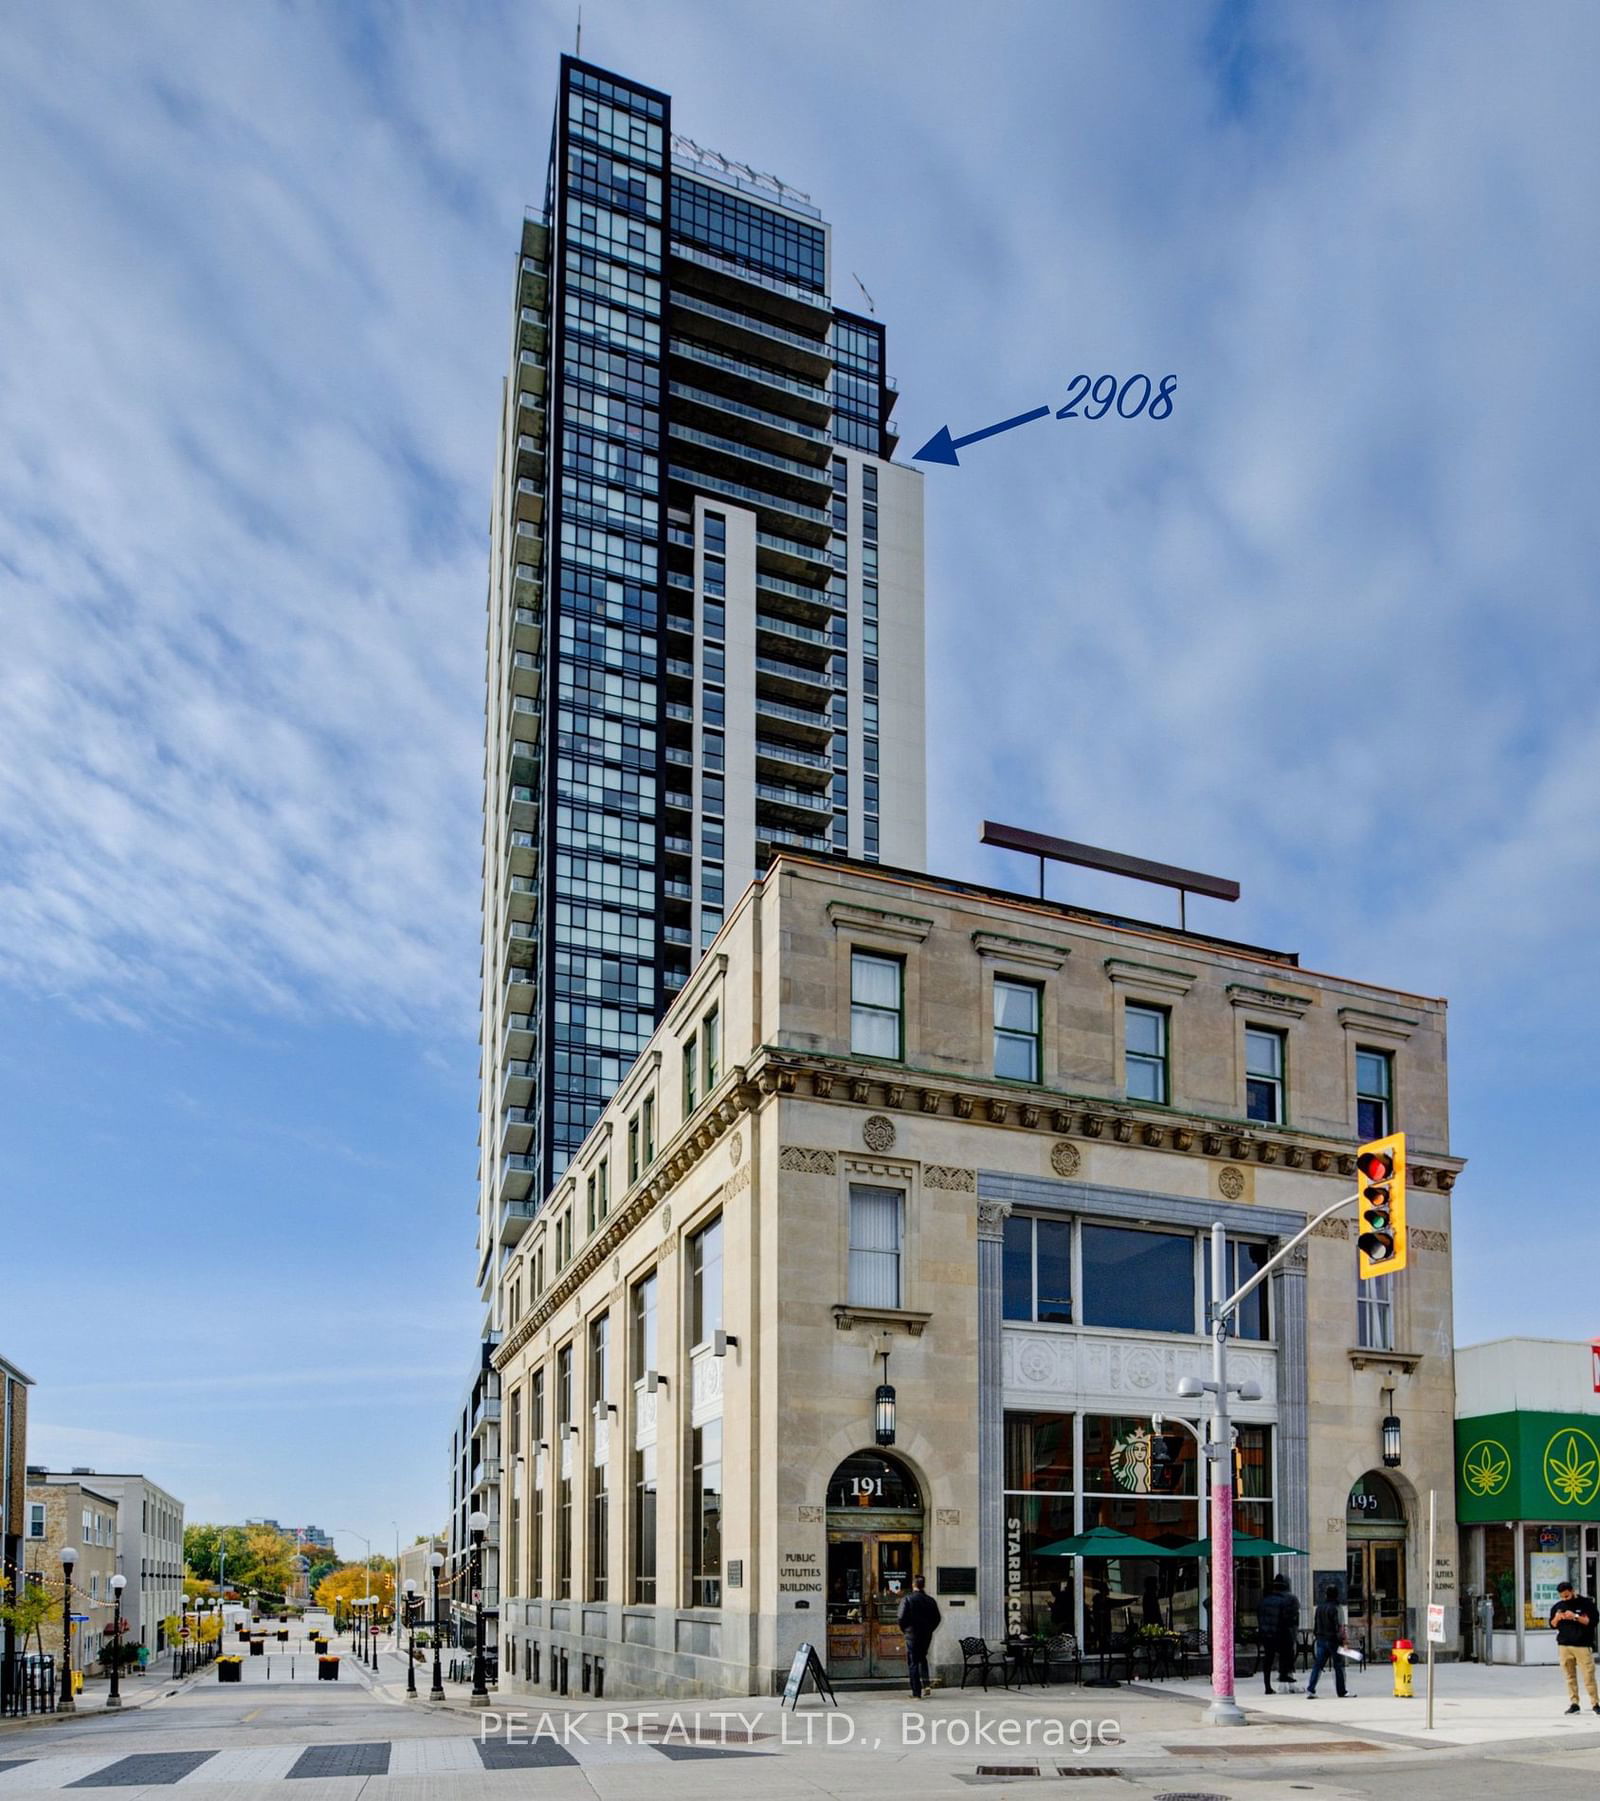
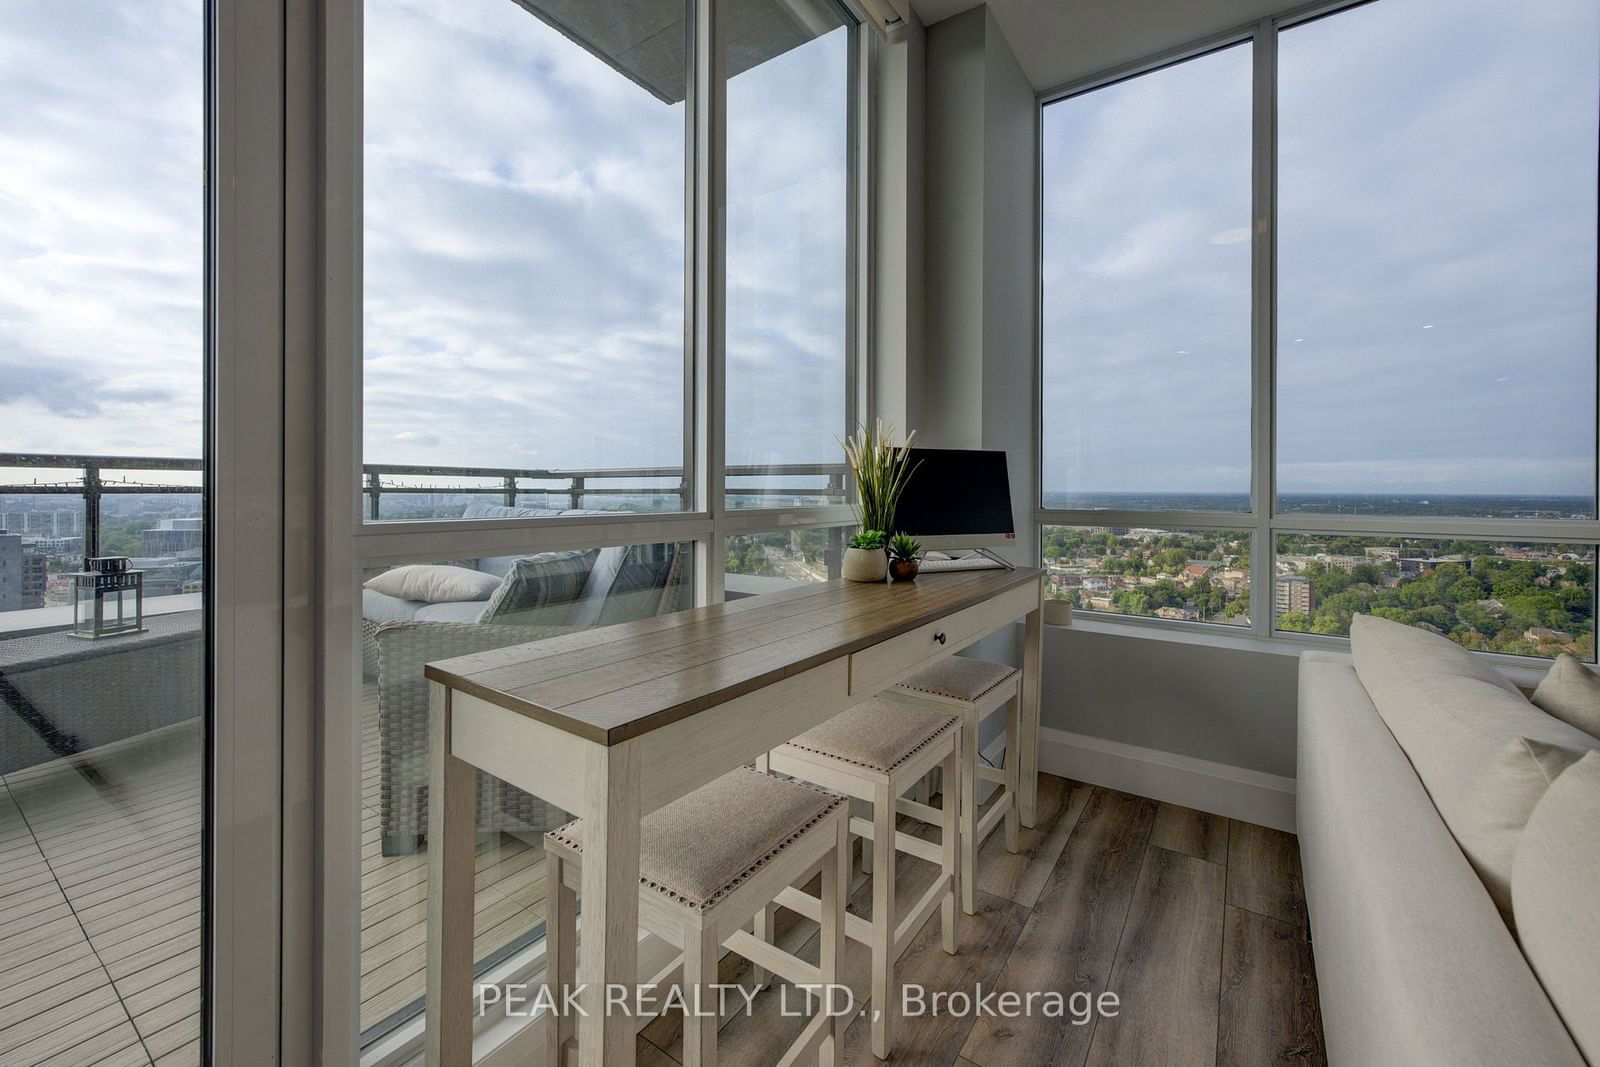
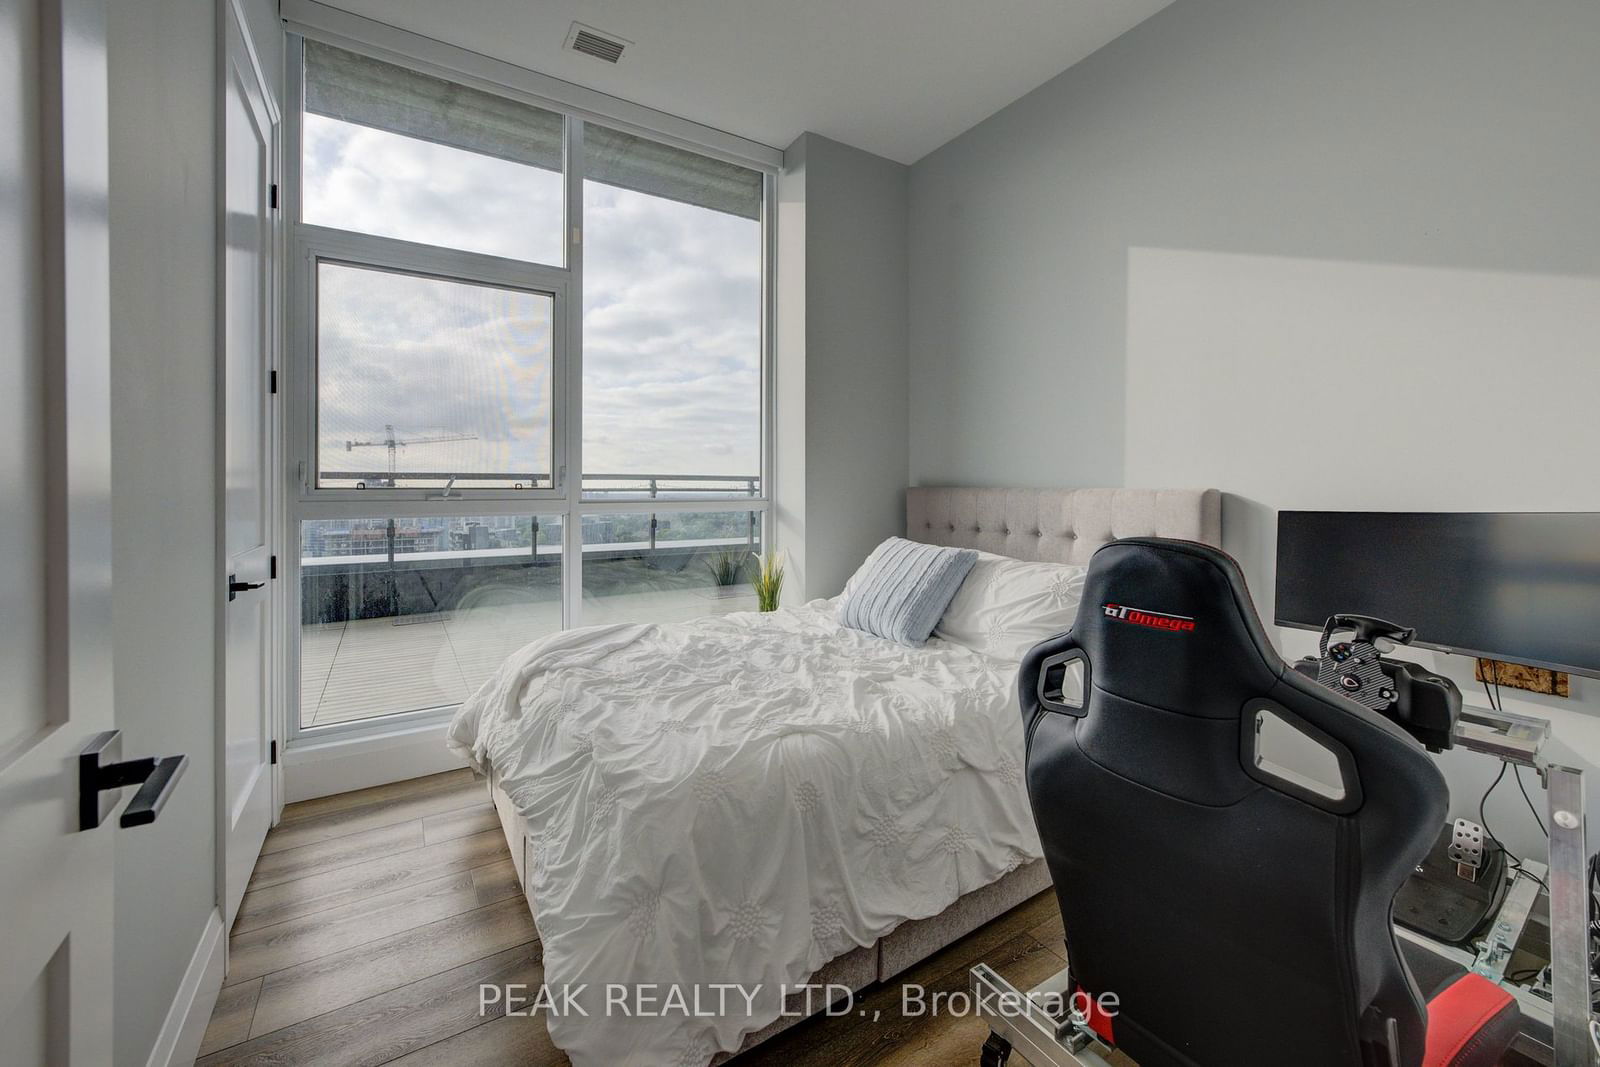
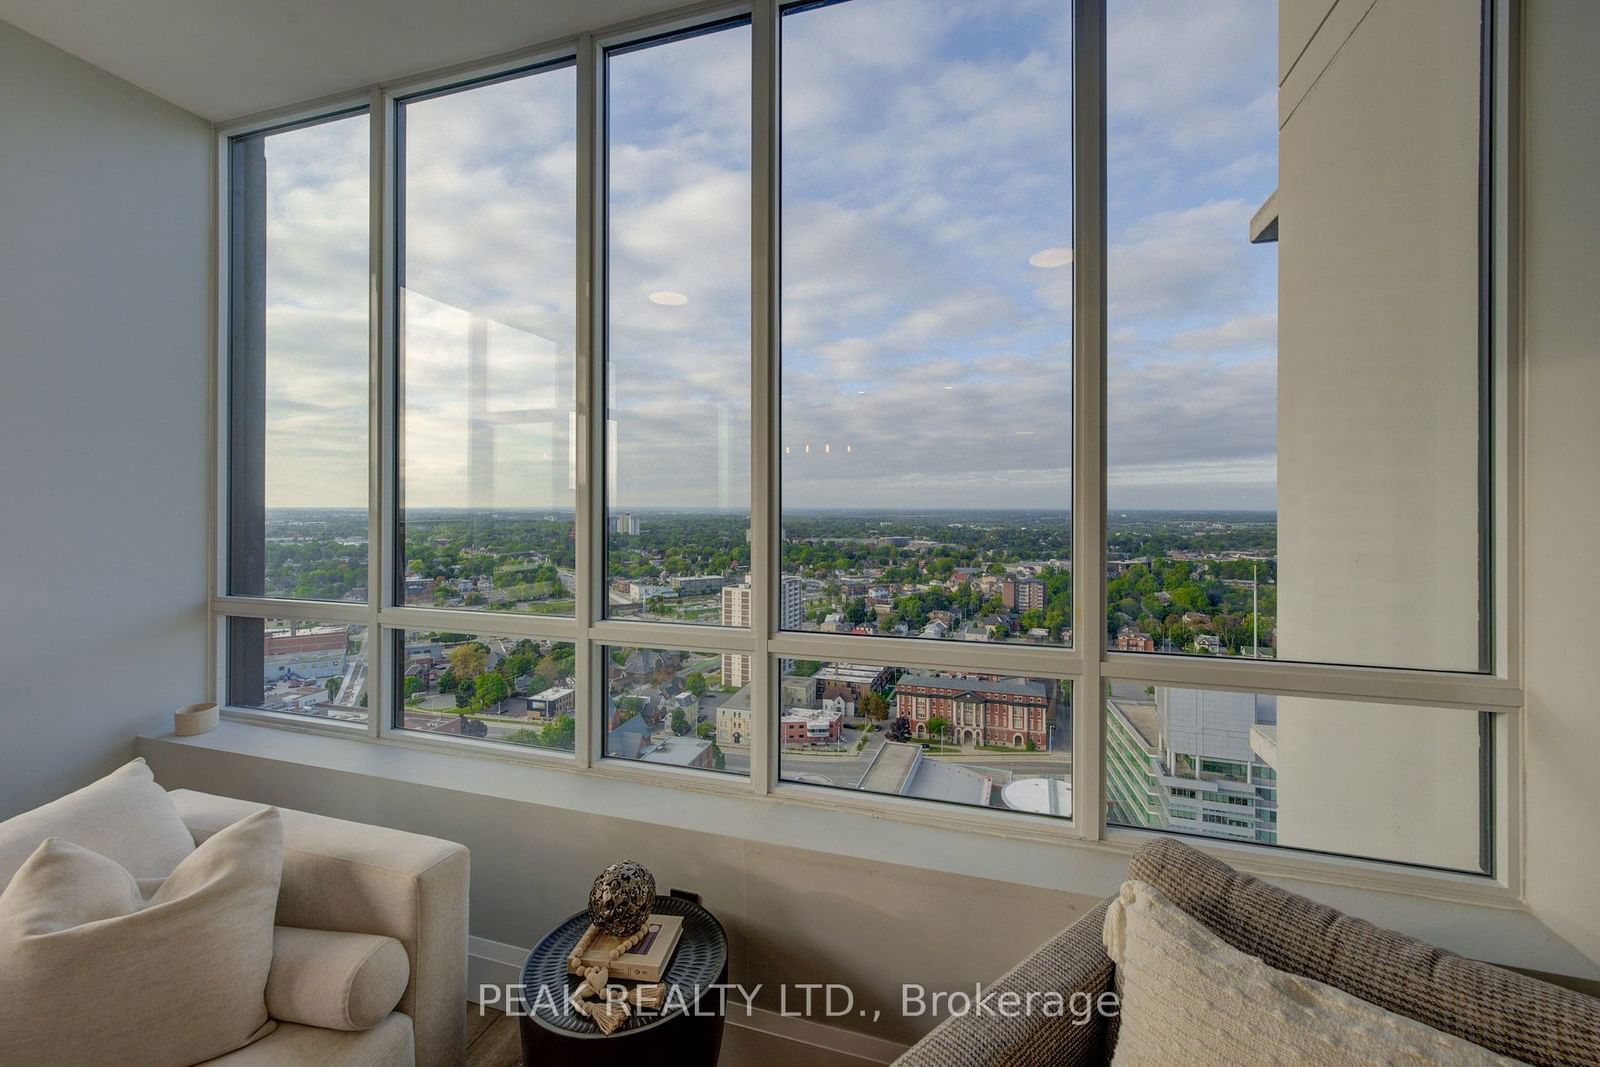
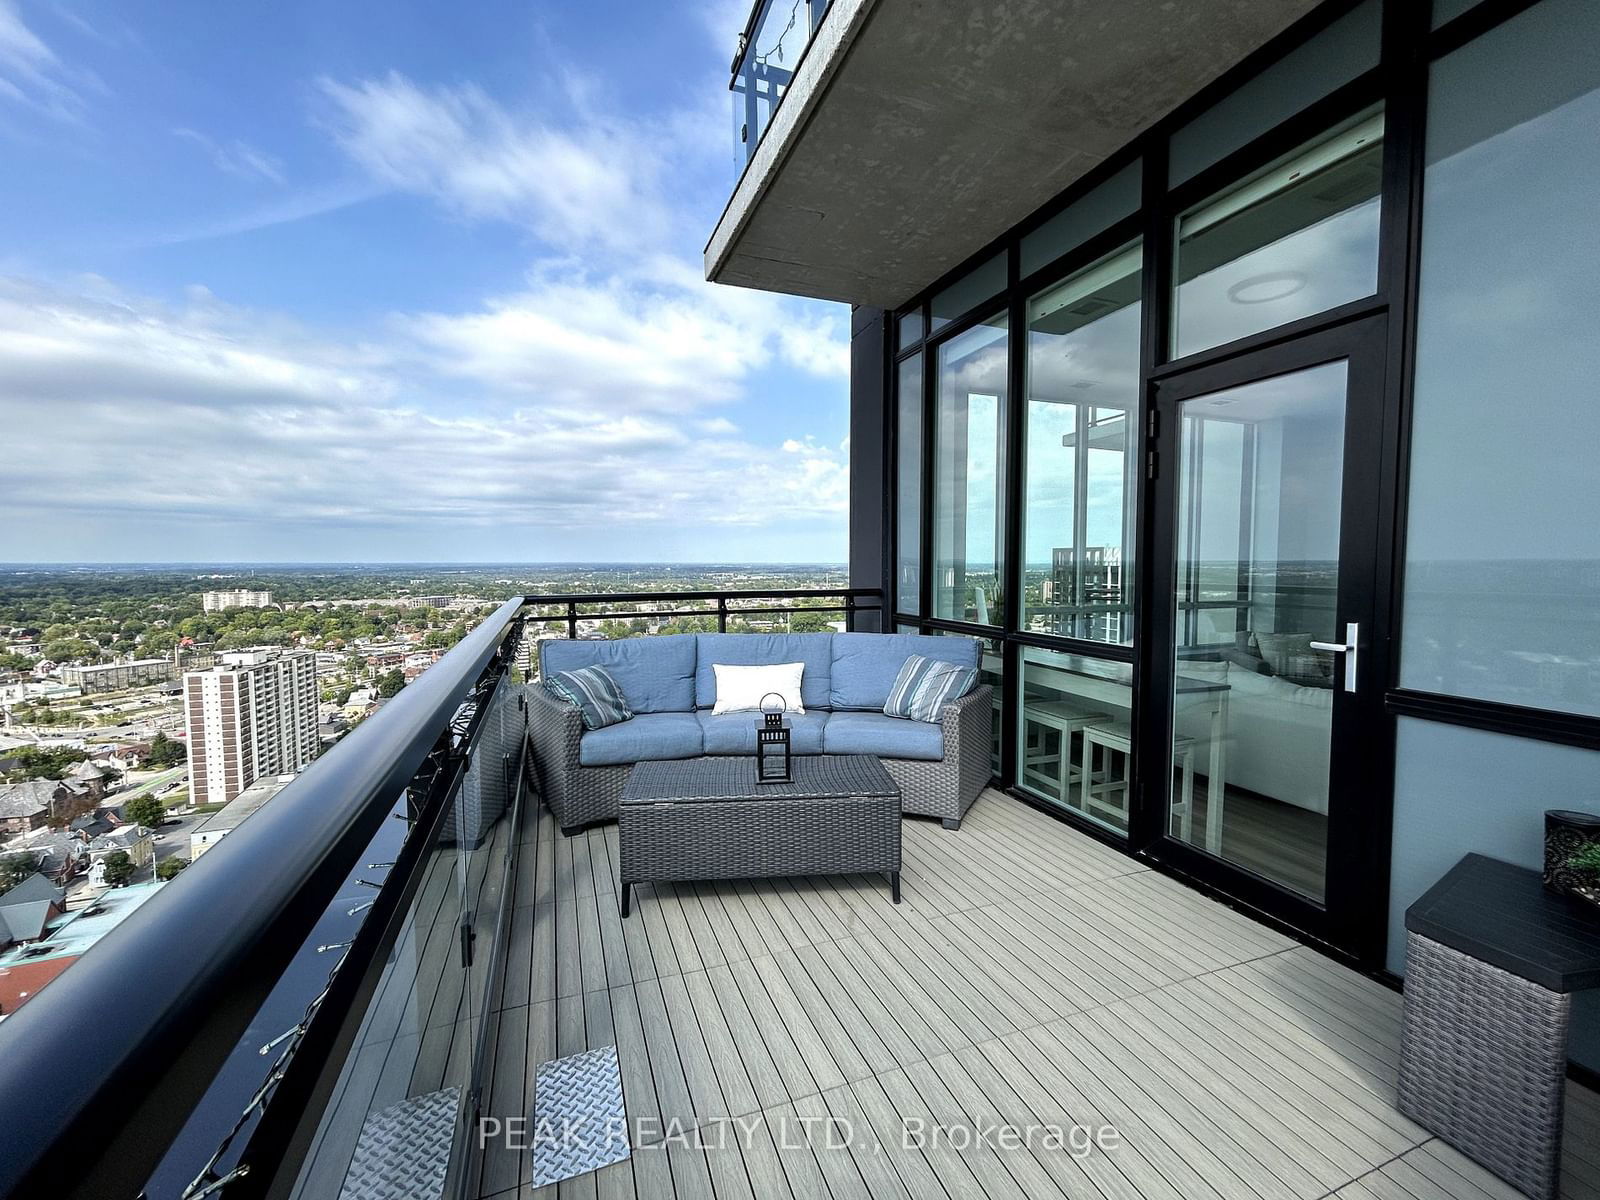
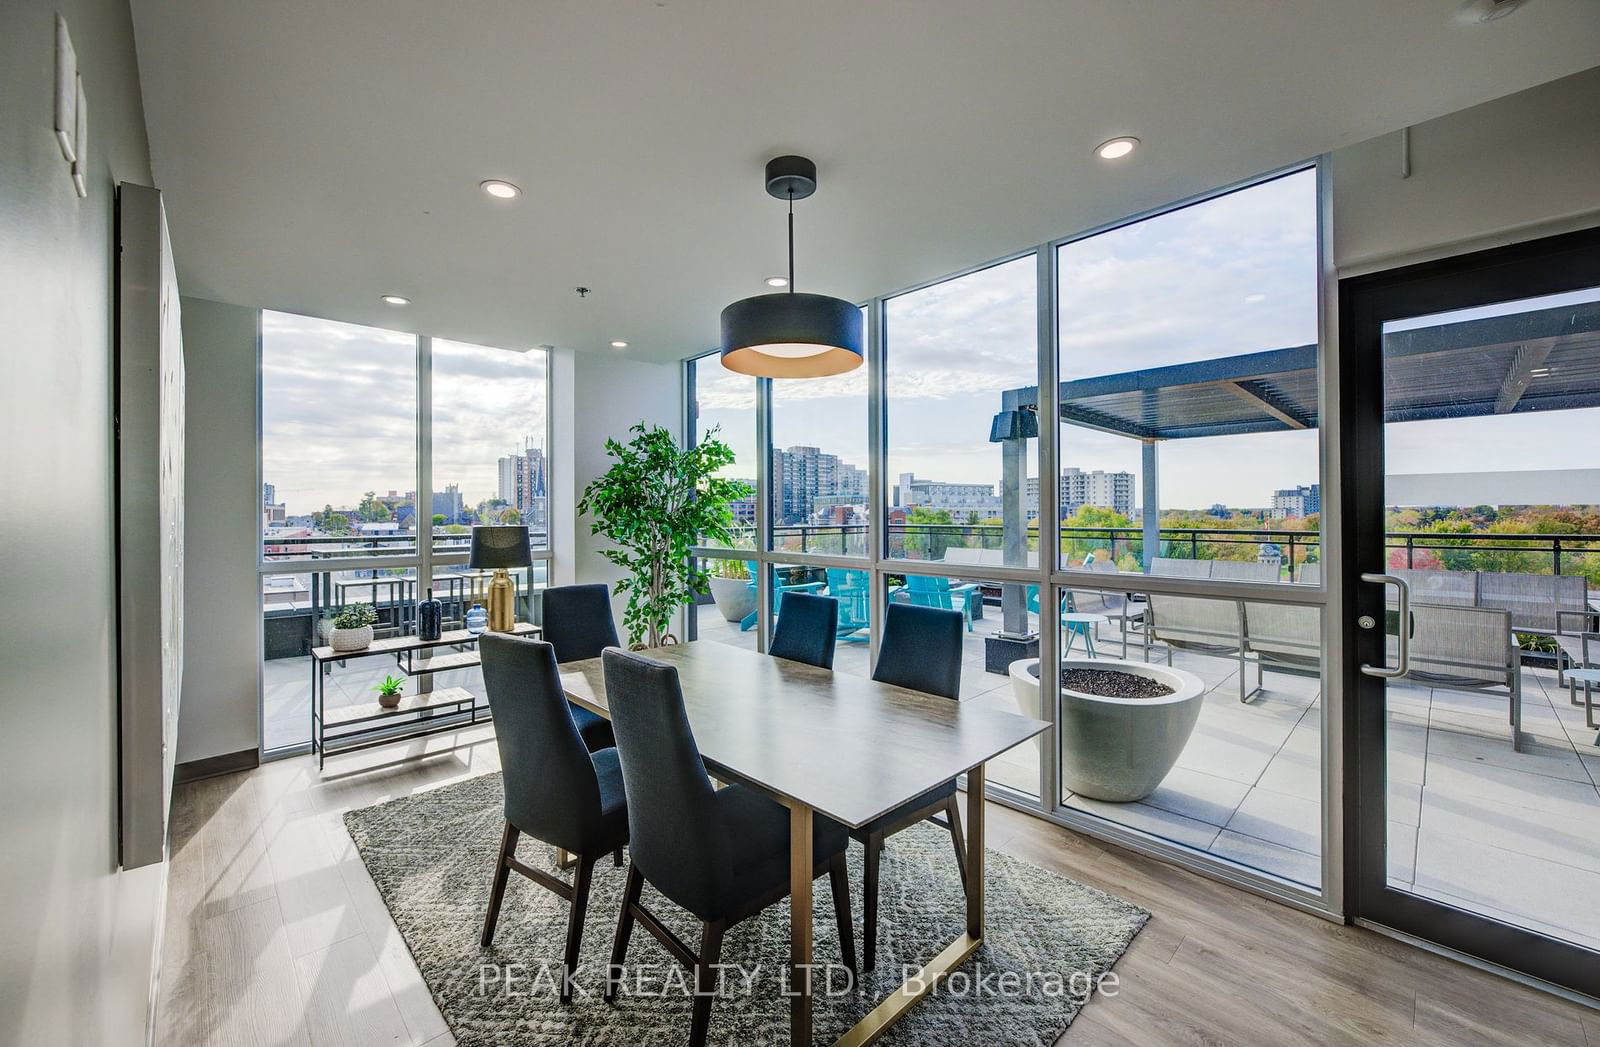
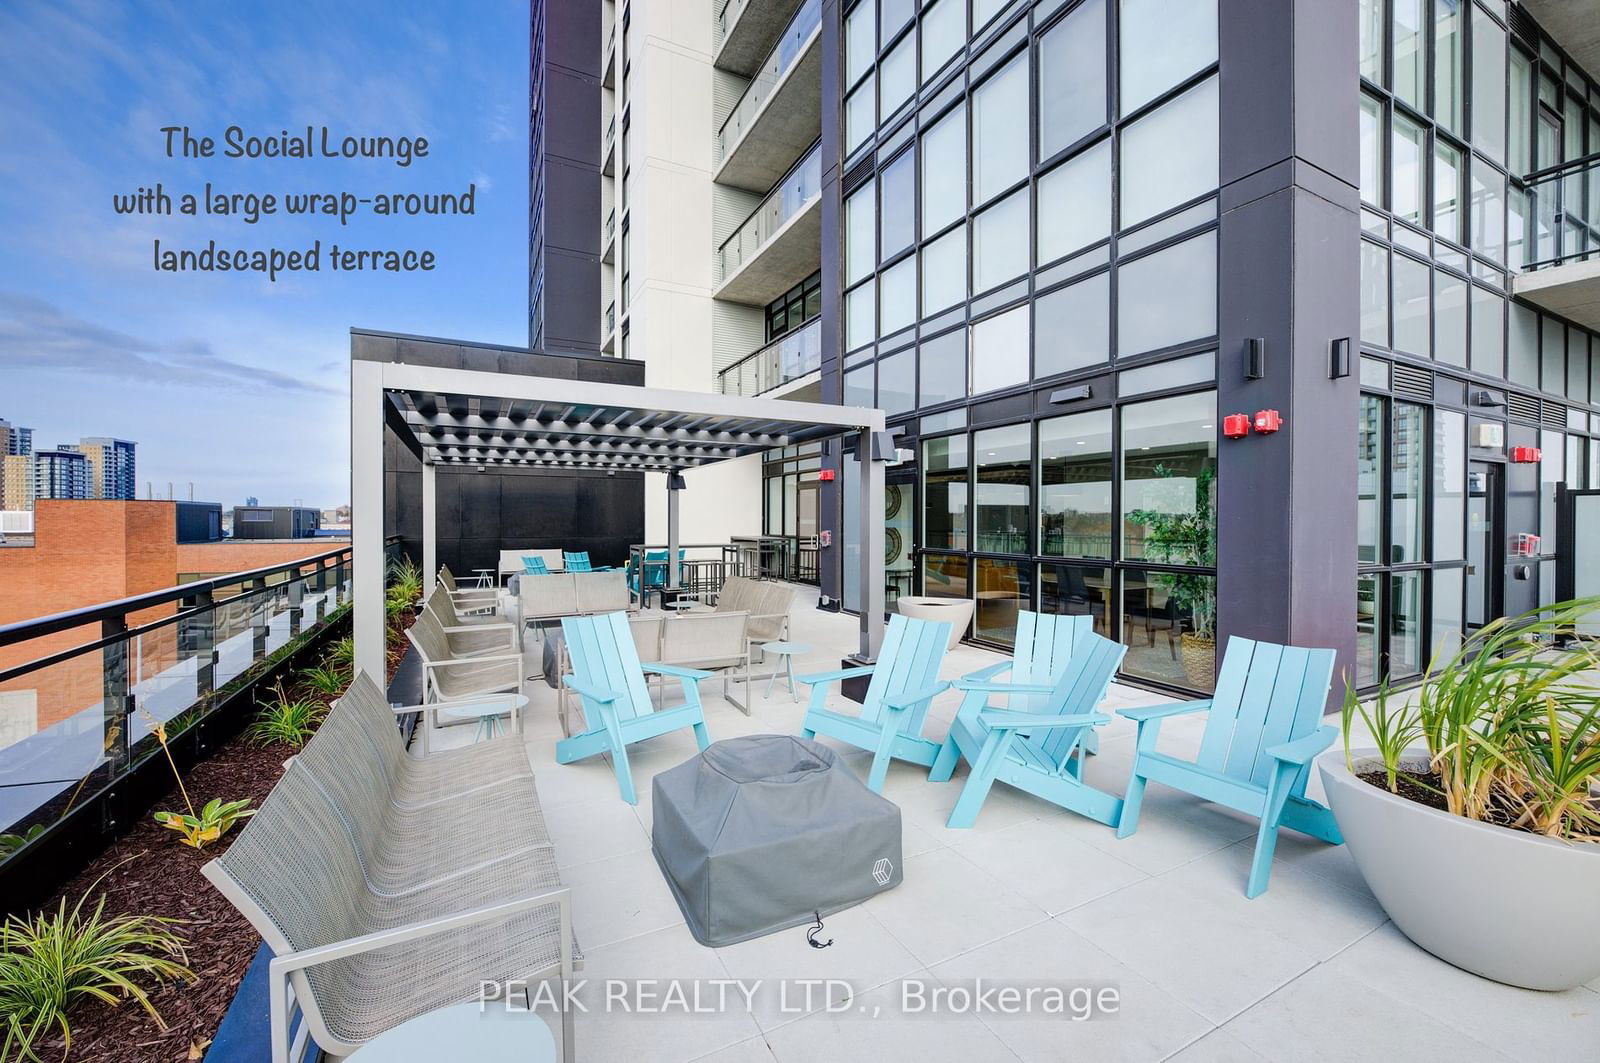
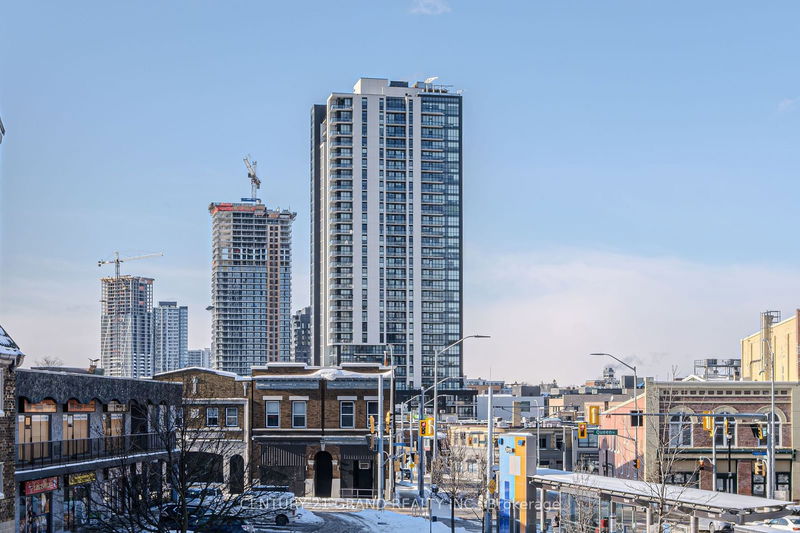
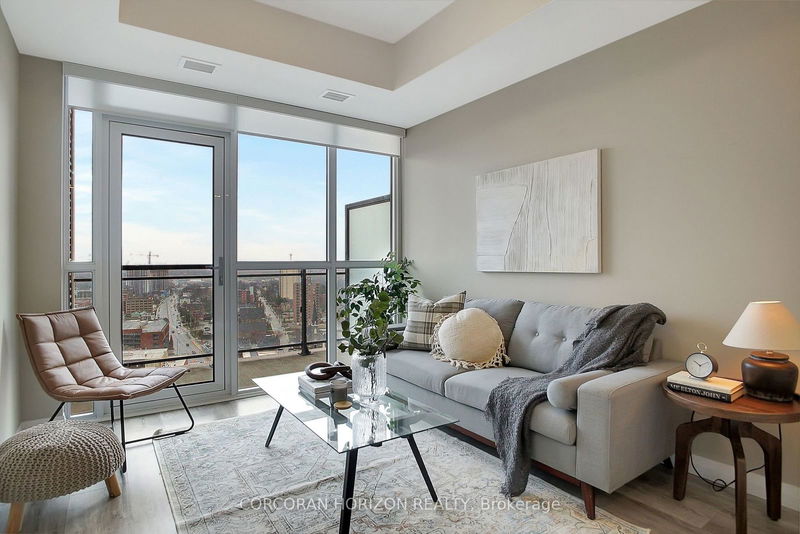
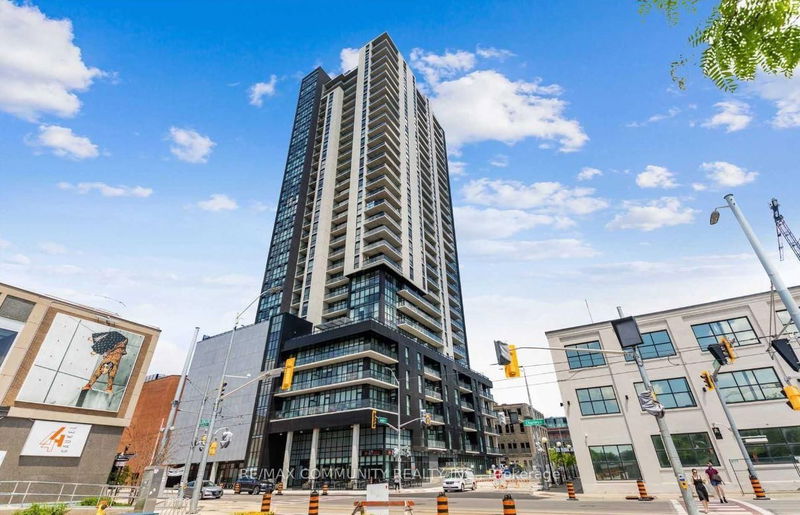
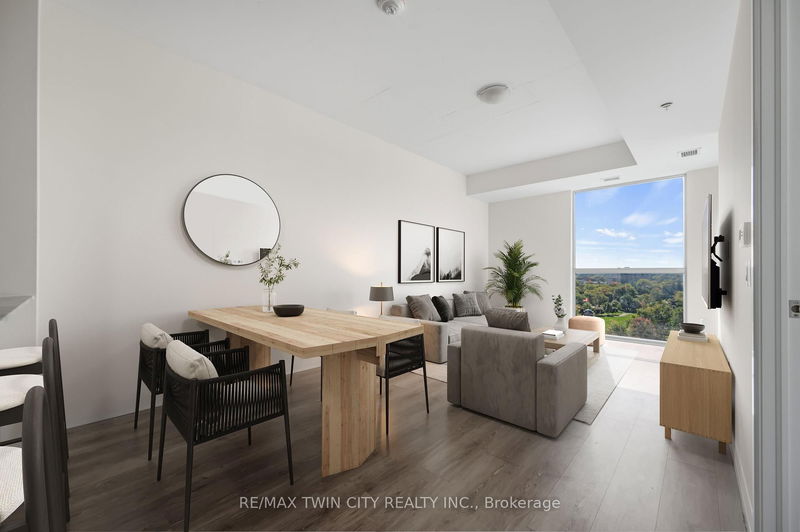
If you’re looking for a Kitchener condo for sale, then Charlie West is a great choice. Standing 31 storeys tall at 60 Charles Street W, this development provides residents with an excellent starting point to explore the City Commercial Core neighbourhood. The property was completed in 2021 by Momentum Developments, and is comprised of 305 units, ranging in size from 502 to 1192 square feet.
Maintenance fees are $0.71 per-square-foot, which is lower than the neighbourhood average of $0.73 per-square-foot.
The Suites
On average, units at 60 Charles Street W sell -3.47% below the list price, and units have a low chance of receiving multiple offers (aka a “bidding war”). The average cost per-square-foot in the condo (based on past 12 months of sales) is $608 and units sell with 29 days on market on average. Over the past 12 months, 5 have sold and 13 have have been rented here.
Transportation
In the event that you can’t land a unit in this building, there are some similar condos within walking distance at 100 Garment Street, 55 Duke Street W and 32 Duke Street.
Maintenance Fees
Listing History for Charlie West
Reviews for Charlie West
No reviews yet. Be the first to leave a review!
 8
8Listings For Sale
Interested in receiving new listings for sale?
Price Cut: $5,000 (Mar 27)
Price Cut: $15,001 (Apr 5)
 1
1Listings For Rent
Interested in receiving new listings for rent?
Similar Condos
Explore City Commercial Core
Commute Calculator
Building Trends At Charlie West
Days on Strata
List vs Selling Price
Offer Competition
Turnover of Units
Property Value
Price Ranking
Sold Units
Rented Units
Best Value Rank
Appreciation Rank
Rental Yield
High Demand
Market Insights
Transaction Insights at Charlie West
| 1 Bed | 1 Bed + Den | 2 Bed | 2 Bed + Den | |
|---|---|---|---|---|
| Price Range | $381,500 - $475,000 | No Data | $540,000 | No Data |
| Avg. Cost Per Sqft | $665 | No Data | $687 | No Data |
| Price Range | $1,700 - $2,200 | $1,980 - $2,100 | $2,500 | No Data |
| Avg. Wait for Unit Availability | 57 Days | 97 Days | 179 Days | No Data |
| Avg. Wait for Unit Availability | 42 Days | 98 Days | 366 Days | No Data |
| Ratio of Units in Building | 60% | 20% | 17% | 3% |
Market Inventory
Total number of units listed and sold in City Commercial Core
