Skip to main

    3 - 1513 Upper Middle Rd

    $869,9993 bds4 ba1 pk1,400 - 1,599 sqft
    44 Days on Strata
    Est Sell Timeframe:
    15 Days
    $869,999
    3 Beds
    4 Bath
    1 Parking
    1,400 - 1,599 SQFT

    Listing History


    Details

    Ownership Type:

    Condominium

    Property Type:

    Townhouse

    Maintenance Fees:

    $630/mth

    Taxes:

    $1,469 (2024)

    Cost Per Sqft:

    $544 - $621/sqft

    Outdoor Space:

    Balcony

    Locker:

    None

    Exposure:

    North

    Possession Date:

    March 2, 2025

    Amenities

    No Data

    About this Listing

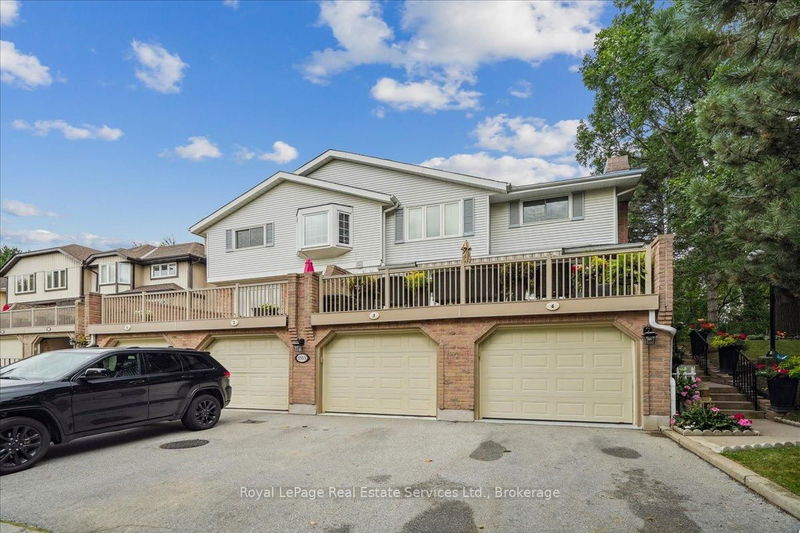
    Move-in ready and fully updated, this 3-bedroom, 4-bathroom condo townhouse offers modern living in a highly desirable Burlington community. Featuring a spacious open-concept layout, this home boasts stylish finishes throughout, including upgraded flooring, a renovated kitchen with quartz countertops & stainless steel appliances, and beautifully updated bathrooms.The fully finished basement provides additional living space, perfect for a family room, home office, or gym. Step outside to your private walk-out patio, ideal for entertaining or relaxing. Enjoy the convenience of a two-car garage and access to fantastic complex amenities, including an outdoor swimming pool and tennis courts.Located just minutes from parks, trails, top-rated schools, shopping, dining, and major highways, this home offers the perfect blend of comfort and convenience. Don't miss this incredible opportunity! Book your private showing today.

    ExtrasNegotiable

    royal lepage real estate services ltd., brokerageMLS® #W11994607

    Fees & Utilities

    Maintenance Fees

    Included in Fees
    Parking
    Building Maintenance
    Not Included
    Hydro
    Heat
    Air Conditioning
    Water

    Utility Type

    Air Conditioning

    Central Air

    Heat Source

    No Data

    Heating

    Forced Air

    Room Dimensions

    Kitchen

    14.01 x 12.01ft

    Dining

    10.07 x 8.99ft

    Living

    17.75 x 11.75ft

    Primary

    12.34 x 12.07ft

    Bathroom

    4 Piece Ensuite

    6.07 x 4.59ft

    Bathroom

    2 Piece Bath

    0 x 0ft

    2nd Bedroom

    11.16 x 10.99ft

    3rd Bedroom

    11.52 x 8.07ft

    Bathroom

    4 Piece Bath

    6 x 5.41ft

    Family

    21 x 15.42ft

    Buyer's Market
    Balanced
    Seller's Market

    Similar Listings

    Explore Tyandaga


    Commute Calculator

    Loading...
    2/10
    Walkability
    A sight of a grocery store is as rare as a unicorn sighting.
    3/10
    Transit
    Transit's playing hard to get, but you might catch it with some charm.
    7/10
    Bikeability
    The bike lane starts to feel like a second home.

    Mortgage Calculator


    Demographics

    Based on the dissemination area as defined by Statistics Canada. A dissemination area contains, on average, approximately 200 – 400 households.

    Population
    2,818
    Average Individual Income
    $82,460
    Average Household Size
    3 persons
    Average Age
    0
    Average Household Income
    $136,465
    Dominant Housing Type
    Detached
    Population By Age
    0 - 14
    19%
    15 - 19
    1%
    20 - 34
    16%
    35 - 49
    22%
    50 - 64
    20%
    65+
    19%
    Household Income
    $0 - $30,000
    40%
    $30,000+
    21%
    $60,000+
    17%
    $90,000+
    13%
    $125,000+
    6%
    Housing Types & Tenancy
    Detached
    78%
    Semi Detached
    19%
    Duplex
    2%
    Marital Status
    Commute
    Languages (Primary Language)
    English
    96%
    Other
    3%
    Urdu
    1%
    Education
    High School
    30%
    University and Above
    25%
    College
    24%
    None
    13%
    Apprenticeship
    4%
    University Below Batchelor
    1%
    Major Field of Study
    Business Management
    24%
    Architecture & Engineering
    17%
    Social Sciences
    14%
    Health & Related Fields
    12%
    Humanities
    6%
    Personal, Protective & Transportation Services
    5%
    Math & Computer Sciences
    5%
    Education
    5%
    Physical Sciences
    4%
    Visual & Performing Arts
    3%
    Agriculture & Natural Resources
    1%


    Days on Strata

    Units at Villas of Nelson Heights spend an average of
    24
    Days on Strata
    based on recent sales

    List vs Selling Price

    On average, these condos sell for
    2%
    below
    the list price.

    Offer Competition

    Condos in this building have a
    LOW
    chance of receiving
    Multiple Offers
    compared to other buildings in Tyandaga

    Turnover of Units

    On average, each unit is owned for
    11.5
    YEARS before being sold again

    Property Value

    -42%
    Decrease in property value within the past twelve months

    Price Ranking

    6th
    Highest price per SQFT out of 10 condos in the Tyandaga area

    Sold Units

    5
    Units were Sold over the past twelve months

    Rented Units

    0
    Units were Rented over the past twelve months

    Best Value Rank

    Villas of Nelson Heights offers the
    ?
    N/A
    best value out of 10 condos in the Tyandaga neighbourhood

    Appreciation Rank

    Villas of Nelson Heights has the
    ?
    N/A
    highest ROI out of 10 condos in the Tyandaga neighbourhood

    Rental Yield

    Villas of Nelson Heights yields the
    ?
    N/A
    highest rent prices out of 10 condos in the Tyandaga neighbourhood

    High Demand

    Villas of Nelson Heights is the
    ?
    N/A
    most popular building out of 10 condos in the Tyandaga neighbourhood

    Market Insights

    Transaction Insights at Villas of Nelson Heights

    2 Bed2 Bed + Den3 Bed3 Bed + Den
    Price Range$850,000No Data$670,000 - $750,000$750,000
    Avg. Cost Per Sqft$503No Data$428$440
    Avg. Wait for Unit Availability129 Days14 Days68 Days357 Days
    Ratio of Units in Building33%3%54%11%

    Market Inventory

    Total number of units listed and sold in Tyandaga